Immigrants from Cameroon vs Immigrants from Japan Wage/Income Gap
COMPARE
Immigrants from Cameroon
Immigrants from Japan
Wage/Income Gap
Wage/Income Gap Comparison
Immigrants from Cameroon
Immigrants from Japan
22.2%
WAGE/INCOME GAP
100.0/ 100
METRIC RATING
52nd/ 347
METRIC RANK
27.9%
WAGE/INCOME GAP
0.7/ 100
METRIC RATING
275th/ 347
METRIC RANK
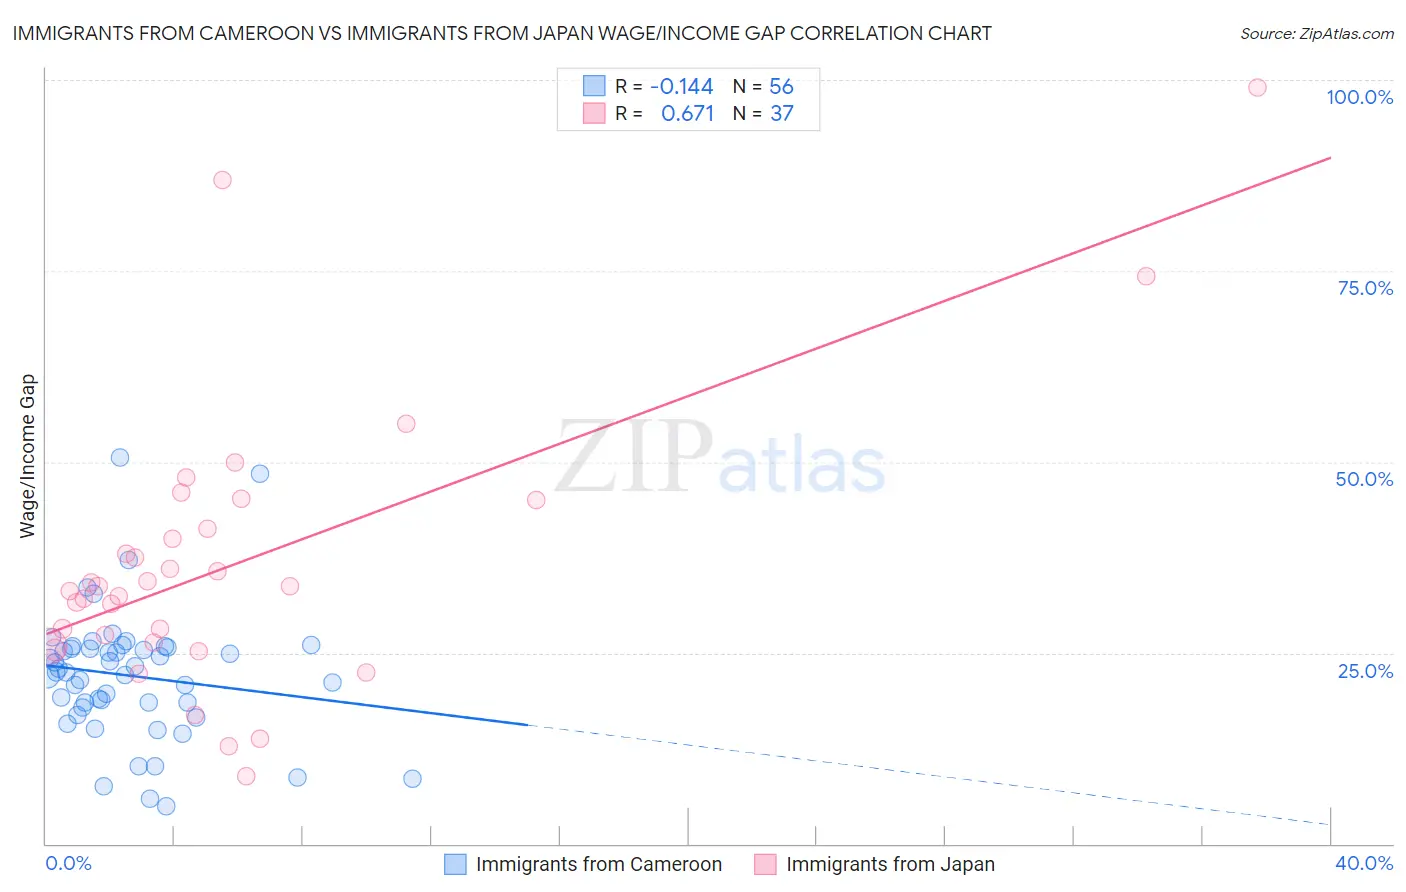
Immigrants from Cameroon vs Immigrants from Japan Wage/Income Gap Correlation Chart
The statistical analysis conducted on geographies consisting of 130,750,722 people shows a poor negative correlation between the proportion of Immigrants from Cameroon and wage/income gap percentage in the United States with a correlation coefficient (R) of -0.144 and weighted average of 22.2%. Similarly, the statistical analysis conducted on geographies consisting of 339,998,398 people shows a significant positive correlation between the proportion of Immigrants from Japan and wage/income gap percentage in the United States with a correlation coefficient (R) of 0.671 and weighted average of 27.9%, a difference of 25.7%.
Wage/Income Gap Correlation Summary
| Measurement | Immigrants from Cameroon | Immigrants from Japan |
| Minimum | 5.0% | 8.9% |
| Maximum | 50.6% | 99.0% |
| Range | 45.7% | 90.1% |
| Mean | 22.0% | 36.7% |
| Median | 22.5% | 33.6% |
| Interquartile 25% (IQ1) | 18.2% | 26.1% |
| Interquartile 75% (IQ3) | 25.6% | 43.1% |
| Interquartile Range (IQR) | 7.5% | 17.0% |
| Standard Deviation (Sample) | 8.5% | 18.4% |
| Standard Deviation (Population) | 8.5% | 18.2% |
Similar Demographics by Wage/Income Gap
Demographics Similar to Immigrants from Cameroon by Wage/Income Gap
In terms of wage/income gap, the demographic groups most similar to Immigrants from Cameroon are Bangladeshi (22.2%, a difference of 0.010%), Tohono O'odham (22.1%, a difference of 0.080%), Nepalese (22.2%, a difference of 0.24%), Immigrants from Western Africa (22.0%, a difference of 0.52%), and Immigrants from Zaire (22.3%, a difference of 0.64%).
| Demographics | Rating | Rank | Wage/Income Gap |
| U.S. Virgin Islanders | 100.0 /100 | #45 | Exceptional 21.5% |
| Immigrants | Ethiopia | 100.0 /100 | #46 | Exceptional 21.6% |
| Immigrants | Congo | 100.0 /100 | #47 | Exceptional 21.7% |
| Blacks/African Americans | 100.0 /100 | #48 | Exceptional 21.7% |
| Ethiopians | 100.0 /100 | #49 | Exceptional 21.8% |
| Immigrants | Western Africa | 100.0 /100 | #50 | Exceptional 22.0% |
| Tohono O'odham | 100.0 /100 | #51 | Exceptional 22.1% |
| Immigrants | Cameroon | 100.0 /100 | #52 | Exceptional 22.2% |
| Bangladeshis | 100.0 /100 | #53 | Exceptional 22.2% |
| Nepalese | 100.0 /100 | #54 | Exceptional 22.2% |
| Immigrants | Zaire | 100.0 /100 | #55 | Exceptional 22.3% |
| Immigrants | Ghana | 100.0 /100 | #56 | Exceptional 22.3% |
| Ghanaians | 100.0 /100 | #57 | Exceptional 22.3% |
| Immigrants | Cuba | 100.0 /100 | #58 | Exceptional 22.4% |
| Navajo | 100.0 /100 | #59 | Exceptional 22.4% |
Demographics Similar to Immigrants from Japan by Wage/Income Gap
In terms of wage/income gap, the demographic groups most similar to Immigrants from Japan are Lebanese (27.9%, a difference of 0.030%), Latvian (27.9%, a difference of 0.030%), American (27.8%, a difference of 0.080%), Immigrants from England (27.9%, a difference of 0.11%), and Bulgarian (27.8%, a difference of 0.12%).
| Demographics | Rating | Rank | Wage/Income Gap |
| New Zealanders | 1.0 /100 | #268 | Tragic 27.7% |
| Potawatomi | 0.9 /100 | #269 | Tragic 27.7% |
| Immigrants | Western Europe | 0.9 /100 | #270 | Tragic 27.8% |
| Ute | 0.8 /100 | #271 | Tragic 27.8% |
| Immigrants | Korea | 0.8 /100 | #272 | Tragic 27.8% |
| Bulgarians | 0.7 /100 | #273 | Tragic 27.8% |
| Americans | 0.7 /100 | #274 | Tragic 27.8% |
| Immigrants | Japan | 0.7 /100 | #275 | Tragic 27.9% |
| Lebanese | 0.7 /100 | #276 | Tragic 27.9% |
| Latvians | 0.7 /100 | #277 | Tragic 27.9% |
| Immigrants | England | 0.6 /100 | #278 | Tragic 27.9% |
| Romanians | 0.5 /100 | #279 | Tragic 28.0% |
| Russians | 0.5 /100 | #280 | Tragic 28.0% |
| Burmese | 0.5 /100 | #281 | Tragic 28.0% |
| South Africans | 0.5 /100 | #282 | Tragic 28.0% |