European vs Spanish American Indian Wage/Income Gap
COMPARE
European
Spanish American Indian
Wage/Income Gap
Wage/Income Gap Comparison
Europeans
Spanish American Indians
29.4%
WAGE/INCOME GAP
0.0/ 100
METRIC RATING
333rd/ 347
METRIC RANK
22.5%
WAGE/INCOME GAP
100.0/ 100
METRIC RATING
64th/ 347
METRIC RANK
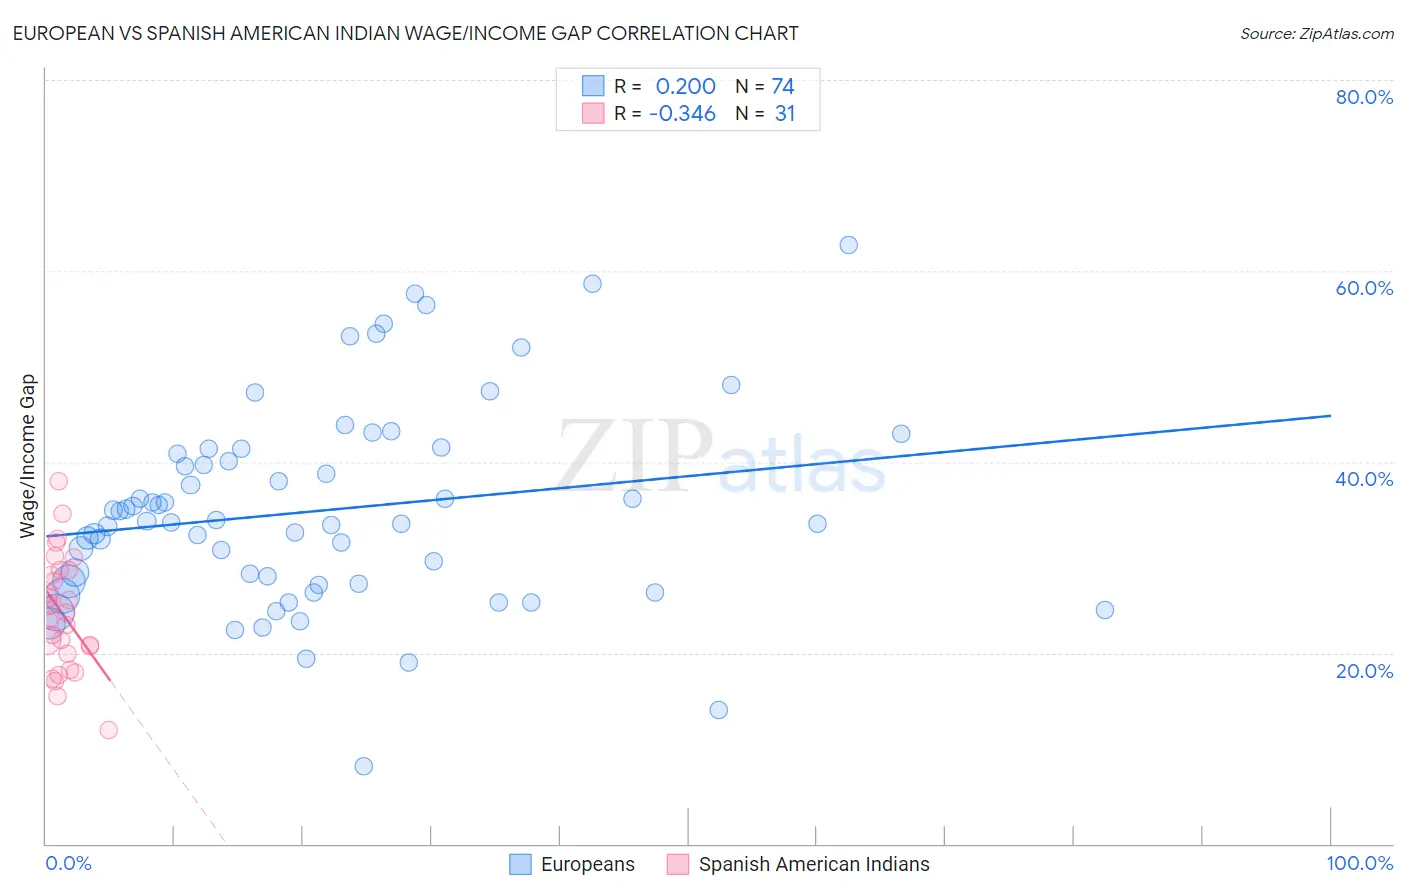
European vs Spanish American Indian Wage/Income Gap Correlation Chart
The statistical analysis conducted on geographies consisting of 559,619,805 people shows a weak positive correlation between the proportion of Europeans and wage/income gap percentage in the United States with a correlation coefficient (R) of 0.200 and weighted average of 29.4%. Similarly, the statistical analysis conducted on geographies consisting of 73,143,386 people shows a mild negative correlation between the proportion of Spanish American Indians and wage/income gap percentage in the United States with a correlation coefficient (R) of -0.346 and weighted average of 22.5%, a difference of 30.3%.
Wage/Income Gap Correlation Summary
| Measurement | European | Spanish American Indian |
| Minimum | 8.1% | 11.9% |
| Maximum | 62.8% | 37.9% |
| Range | 54.6% | 26.0% |
| Mean | 34.9% | 24.1% |
| Median | 33.8% | 24.3% |
| Interquartile 25% (IQ1) | 27.2% | 19.9% |
| Interquartile 75% (IQ3) | 40.8% | 28.6% |
| Interquartile Range (IQR) | 13.6% | 8.8% |
| Standard Deviation (Sample) | 10.6% | 6.0% |
| Standard Deviation (Population) | 10.5% | 5.9% |
Similar Demographics by Wage/Income Gap
Demographics Similar to Europeans by Wage/Income Gap
In terms of wage/income gap, the demographic groups most similar to Europeans are Swedish (29.4%, a difference of 0.14%), Immigrants from South Central Asia (29.3%, a difference of 0.19%), Immigrants from Taiwan (29.5%, a difference of 0.27%), English (29.5%, a difference of 0.28%), and Czech (29.2%, a difference of 0.70%).
| Demographics | Rating | Rank | Wage/Income Gap |
| Immigrants | Belgium | 0.0 /100 | #326 | Tragic 29.0% |
| Immigrants | Iran | 0.0 /100 | #327 | Tragic 29.1% |
| Scandinavians | 0.0 /100 | #328 | Tragic 29.1% |
| Scottish | 0.0 /100 | #329 | Tragic 29.1% |
| Germans | 0.0 /100 | #330 | Tragic 29.2% |
| Czechs | 0.0 /100 | #331 | Tragic 29.2% |
| Immigrants | South Central Asia | 0.0 /100 | #332 | Tragic 29.3% |
| Europeans | 0.0 /100 | #333 | Tragic 29.4% |
| Swedes | 0.0 /100 | #334 | Tragic 29.4% |
| Immigrants | Taiwan | 0.0 /100 | #335 | Tragic 29.5% |
| English | 0.0 /100 | #336 | Tragic 29.5% |
| Dutch | 0.0 /100 | #337 | Tragic 29.6% |
| Filipinos | 0.0 /100 | #338 | Tragic 29.7% |
| Iranians | 0.0 /100 | #339 | Tragic 29.7% |
| Swiss | 0.0 /100 | #340 | Tragic 30.0% |
Demographics Similar to Spanish American Indians by Wage/Income Gap
In terms of wage/income gap, the demographic groups most similar to Spanish American Indians are Immigrants from Ecuador (22.5%, a difference of 0.29%), Guatemalan (22.6%, a difference of 0.32%), Immigrants from Guatemala (22.5%, a difference of 0.43%), Central American Indian (22.7%, a difference of 0.56%), and Immigrants from Fiji (22.4%, a difference of 0.64%).
| Demographics | Rating | Rank | Wage/Income Gap |
| Ghanaians | 100.0 /100 | #57 | Exceptional 22.3% |
| Immigrants | Cuba | 100.0 /100 | #58 | Exceptional 22.4% |
| Navajo | 100.0 /100 | #59 | Exceptional 22.4% |
| Immigrants | Middle Africa | 100.0 /100 | #60 | Exceptional 22.4% |
| Immigrants | Fiji | 100.0 /100 | #61 | Exceptional 22.4% |
| Immigrants | Guatemala | 100.0 /100 | #62 | Exceptional 22.5% |
| Immigrants | Ecuador | 100.0 /100 | #63 | Exceptional 22.5% |
| Spanish American Indians | 100.0 /100 | #64 | Exceptional 22.5% |
| Guatemalans | 99.9 /100 | #65 | Exceptional 22.6% |
| Central American Indians | 99.9 /100 | #66 | Exceptional 22.7% |
| Menominee | 99.9 /100 | #67 | Exceptional 22.7% |
| Immigrants | Nigeria | 99.9 /100 | #68 | Exceptional 22.7% |
| Indonesians | 99.9 /100 | #69 | Exceptional 22.7% |
| Immigrants | Uzbekistan | 99.9 /100 | #70 | Exceptional 22.7% |
| Immigrants | El Salvador | 99.9 /100 | #71 | Exceptional 22.8% |