Hungarian vs Immigrants from Ecuador Cognitive Disability
COMPARE
Hungarian
Immigrants from Ecuador
Cognitive Disability
Cognitive Disability Comparison
Hungarians
Immigrants from Ecuador
16.5%
COGNITIVE DISABILITY
99.9/ 100
METRIC RATING
42nd/ 347
METRIC RANK
17.2%
COGNITIVE DISABILITY
64.4/ 100
METRIC RATING
166th/ 347
METRIC RANK
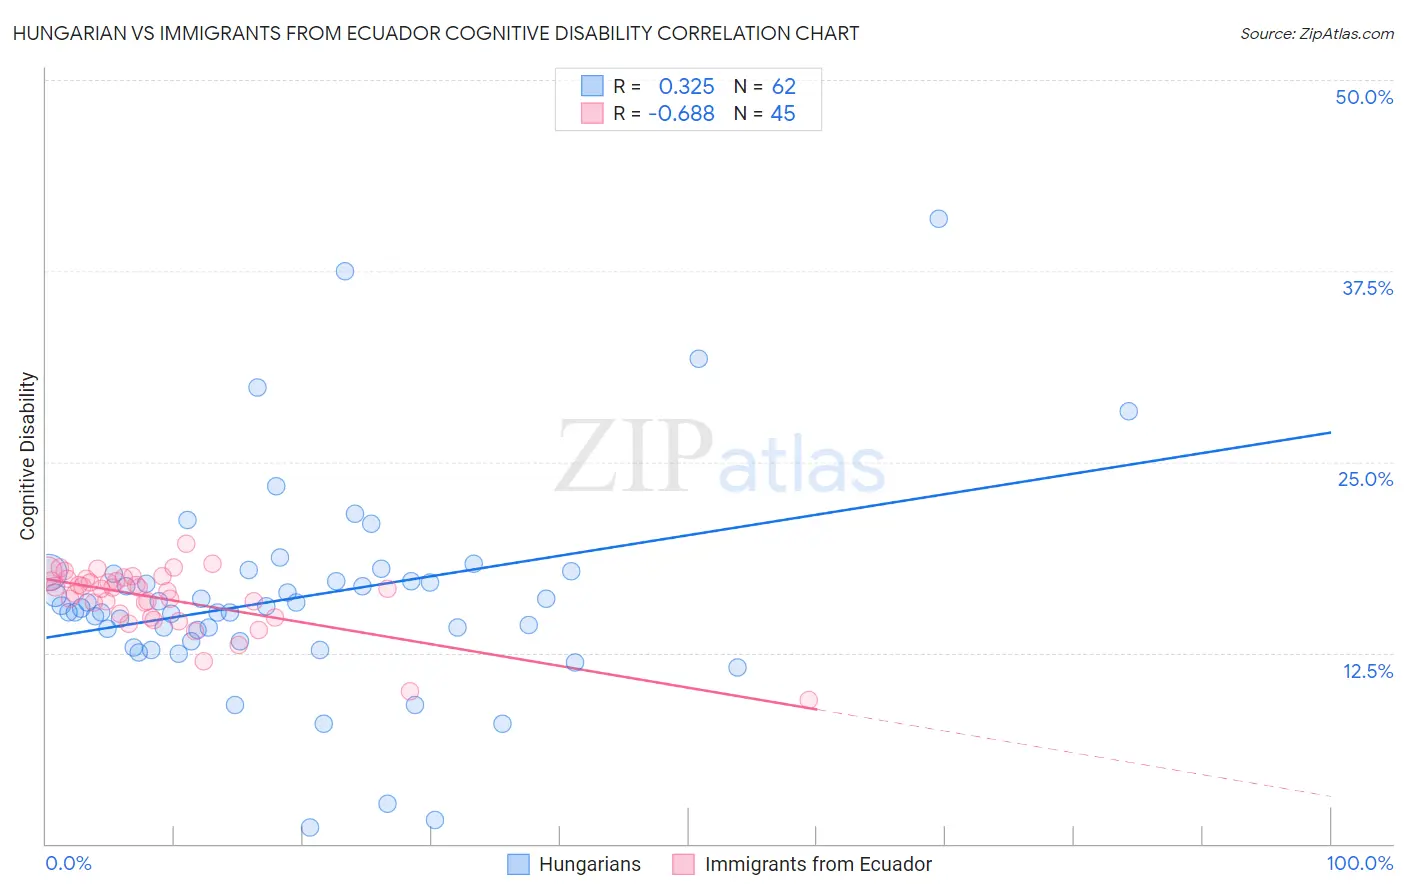
Hungarian vs Immigrants from Ecuador Cognitive Disability Correlation Chart
The statistical analysis conducted on geographies consisting of 486,167,723 people shows a mild positive correlation between the proportion of Hungarians and percentage of population with cognitive disability in the United States with a correlation coefficient (R) of 0.325 and weighted average of 16.5%. Similarly, the statistical analysis conducted on geographies consisting of 270,972,239 people shows a significant negative correlation between the proportion of Immigrants from Ecuador and percentage of population with cognitive disability in the United States with a correlation coefficient (R) of -0.688 and weighted average of 17.2%, a difference of 4.4%.
Cognitive Disability Correlation Summary
| Measurement | Hungarian | Immigrants from Ecuador |
| Minimum | 1.0% | 9.4% |
| Maximum | 40.9% | 19.7% |
| Range | 39.9% | 10.3% |
| Mean | 16.1% | 16.1% |
| Median | 15.5% | 16.7% |
| Interquartile 25% (IQ1) | 13.3% | 14.9% |
| Interquartile 75% (IQ3) | 17.7% | 17.3% |
| Interquartile Range (IQR) | 4.4% | 2.4% |
| Standard Deviation (Sample) | 6.8% | 2.0% |
| Standard Deviation (Population) | 6.7% | 2.0% |
Similar Demographics by Cognitive Disability
Demographics Similar to Hungarians by Cognitive Disability
In terms of cognitive disability, the demographic groups most similar to Hungarians are Cuban (16.5%, a difference of 0.010%), Immigrants from Belarus (16.5%, a difference of 0.020%), Bolivian (16.5%, a difference of 0.030%), Immigrants from Canada (16.5%, a difference of 0.060%), and Macedonian (16.5%, a difference of 0.090%).
| Demographics | Rating | Rank | Cognitive Disability |
| Slovaks | 99.9 /100 | #35 | Exceptional 16.4% |
| Greeks | 99.9 /100 | #36 | Exceptional 16.4% |
| Slovenes | 99.9 /100 | #37 | Exceptional 16.5% |
| Immigrants | Eastern Europe | 99.9 /100 | #38 | Exceptional 16.5% |
| Bolivians | 99.9 /100 | #39 | Exceptional 16.5% |
| Immigrants | Belarus | 99.9 /100 | #40 | Exceptional 16.5% |
| Cubans | 99.9 /100 | #41 | Exceptional 16.5% |
| Hungarians | 99.9 /100 | #42 | Exceptional 16.5% |
| Immigrants | Canada | 99.8 /100 | #43 | Exceptional 16.5% |
| Macedonians | 99.8 /100 | #44 | Exceptional 16.5% |
| Immigrants | Europe | 99.8 /100 | #45 | Exceptional 16.5% |
| Immigrants | Colombia | 99.8 /100 | #46 | Exceptional 16.5% |
| Immigrants | Italy | 99.8 /100 | #47 | Exceptional 16.5% |
| Immigrants | North America | 99.8 /100 | #48 | Exceptional 16.5% |
| Iranians | 99.8 /100 | #49 | Exceptional 16.5% |
Demographics Similar to Immigrants from Ecuador by Cognitive Disability
In terms of cognitive disability, the demographic groups most similar to Immigrants from Ecuador are Immigrants from Albania (17.2%, a difference of 0.010%), Immigrants from Syria (17.2%, a difference of 0.030%), Immigrants (17.2%, a difference of 0.060%), Immigrants from Portugal (17.2%, a difference of 0.080%), and Ecuadorian (17.2%, a difference of 0.15%).
| Demographics | Rating | Rank | Cognitive Disability |
| Immigrants | Latvia | 73.2 /100 | #159 | Good 17.2% |
| Australians | 72.4 /100 | #160 | Good 17.2% |
| Americans | 72.2 /100 | #161 | Good 17.2% |
| Yugoslavians | 71.6 /100 | #162 | Good 17.2% |
| Immigrants | Switzerland | 71.5 /100 | #163 | Good 17.2% |
| Armenians | 70.1 /100 | #164 | Good 17.2% |
| Immigrants | Albania | 64.9 /100 | #165 | Good 17.2% |
| Immigrants | Ecuador | 64.4 /100 | #166 | Good 17.2% |
| Immigrants | Syria | 63.5 /100 | #167 | Good 17.2% |
| Immigrants | Immigrants | 62.5 /100 | #168 | Good 17.2% |
| Immigrants | Portugal | 61.8 /100 | #169 | Good 17.2% |
| Ecuadorians | 59.6 /100 | #170 | Average 17.2% |
| Tlingit-Haida | 59.4 /100 | #171 | Average 17.2% |
| Immigrants | Turkey | 56.7 /100 | #172 | Average 17.2% |
| Immigrants | Northern Africa | 50.2 /100 | #173 | Average 17.3% |