Macedonian vs Immigrants from Ecuador Per Capita Income
COMPARE
Macedonian
Immigrants from Ecuador
Per Capita Income
Per Capita Income Comparison
Macedonians
Immigrants from Ecuador
$47,573
PER CAPITA INCOME
98.8/ 100
METRIC RATING
91st/ 347
METRIC RANK
$41,195
PER CAPITA INCOME
5.9/ 100
METRIC RATING
226th/ 347
METRIC RANK
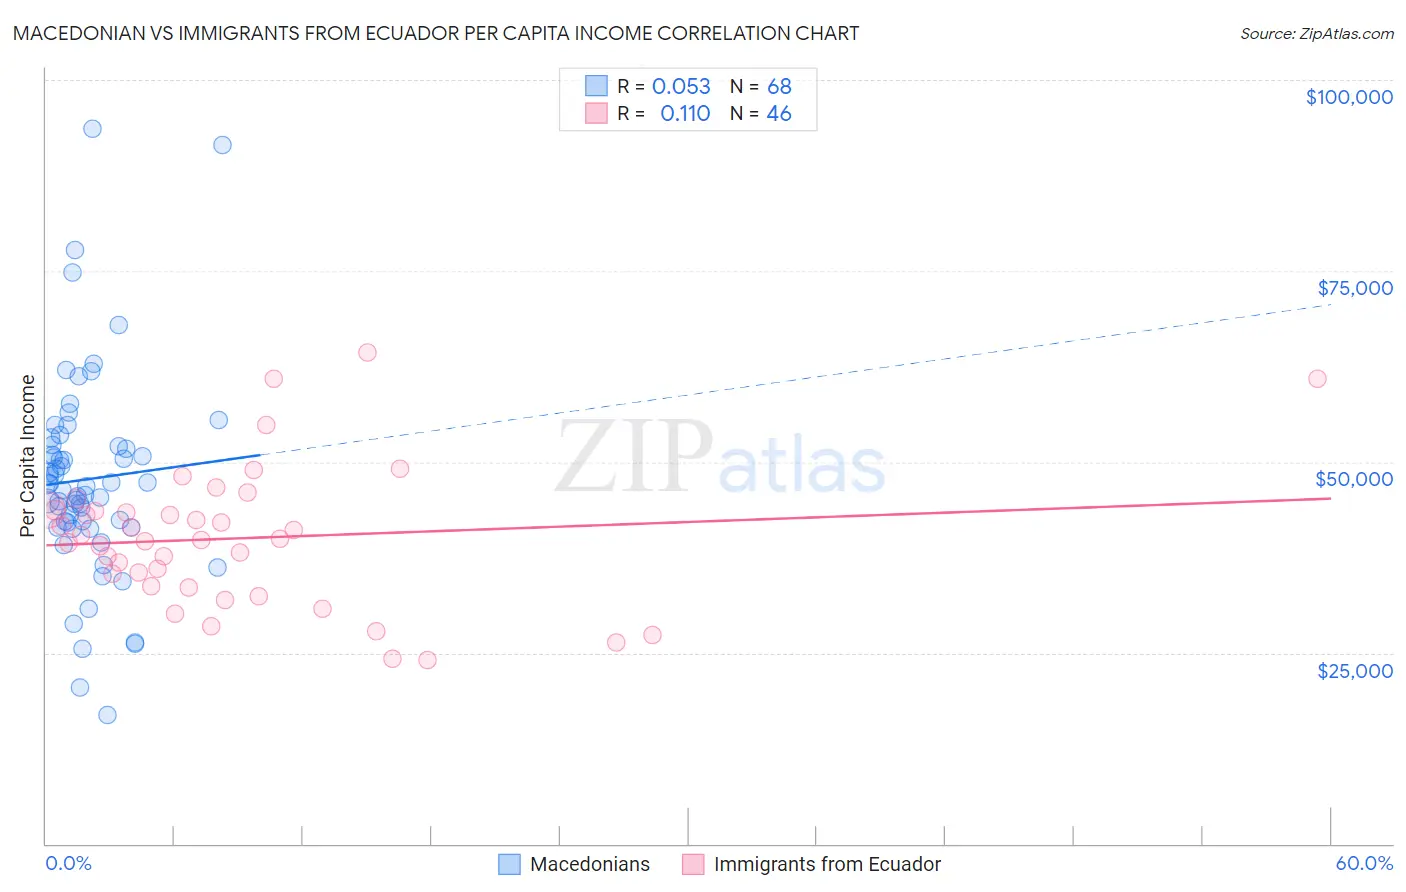
Macedonian vs Immigrants from Ecuador Per Capita Income Correlation Chart
The statistical analysis conducted on geographies consisting of 132,587,632 people shows a slight positive correlation between the proportion of Macedonians and per capita income in the United States with a correlation coefficient (R) of 0.053 and weighted average of $47,573. Similarly, the statistical analysis conducted on geographies consisting of 271,002,602 people shows a poor positive correlation between the proportion of Immigrants from Ecuador and per capita income in the United States with a correlation coefficient (R) of 0.110 and weighted average of $41,195, a difference of 15.5%.
Per Capita Income Correlation Summary
| Measurement | Macedonian | Immigrants from Ecuador |
| Minimum | $16,916 | $24,078 |
| Maximum | $93,662 | $64,385 |
| Range | $76,746 | $40,307 |
| Mean | $47,728 | $40,002 |
| Median | $46,977 | $39,852 |
| Interquartile 25% (IQ1) | $41,808 | $33,648 |
| Interquartile 75% (IQ3) | $52,108 | $43,627 |
| Interquartile Range (IQR) | $10,300 | $9,979 |
| Standard Deviation (Sample) | $13,530 | $9,075 |
| Standard Deviation (Population) | $13,431 | $8,976 |
Similar Demographics by Per Capita Income
Demographics Similar to Macedonians by Per Capita Income
In terms of per capita income, the demographic groups most similar to Macedonians are Italian ($47,574, a difference of 0.0%), Immigrants from Moldova ($47,489, a difference of 0.18%), Northern European ($47,698, a difference of 0.26%), Croatian ($47,742, a difference of 0.36%), and Immigrants from Zimbabwe ($47,394, a difference of 0.38%).
| Demographics | Rating | Rank | Per Capita Income |
| Immigrants | Ukraine | 99.3 /100 | #84 | Exceptional $48,134 |
| Austrians | 99.3 /100 | #85 | Exceptional $48,116 |
| Immigrants | Southern Europe | 99.3 /100 | #86 | Exceptional $48,027 |
| Ukrainians | 99.3 /100 | #87 | Exceptional $48,014 |
| Croatians | 99.0 /100 | #88 | Exceptional $47,742 |
| Northern Europeans | 98.9 /100 | #89 | Exceptional $47,698 |
| Italians | 98.8 /100 | #90 | Exceptional $47,574 |
| Macedonians | 98.8 /100 | #91 | Exceptional $47,573 |
| Immigrants | Moldova | 98.7 /100 | #92 | Exceptional $47,489 |
| Immigrants | Zimbabwe | 98.5 /100 | #93 | Exceptional $47,394 |
| Albanians | 98.5 /100 | #94 | Exceptional $47,379 |
| Immigrants | Egypt | 98.5 /100 | #95 | Exceptional $47,361 |
| Alsatians | 98.3 /100 | #96 | Exceptional $47,284 |
| Carpatho Rusyns | 98.2 /100 | #97 | Exceptional $47,248 |
| Immigrants | Pakistan | 97.9 /100 | #98 | Exceptional $47,084 |
Demographics Similar to Immigrants from Ecuador by Per Capita Income
In terms of per capita income, the demographic groups most similar to Immigrants from Ecuador are West Indian ($41,217, a difference of 0.050%), Immigrants from Ghana ($41,131, a difference of 0.16%), Immigrants from Grenada ($41,123, a difference of 0.17%), Immigrants from St. Vincent and the Grenadines ($41,270, a difference of 0.18%), and Immigrants from Cameroon ($41,334, a difference of 0.34%).
| Demographics | Rating | Rank | Per Capita Income |
| Puget Sound Salish | 8.1 /100 | #219 | Tragic $41,495 |
| Immigrants | Barbados | 7.9 /100 | #220 | Tragic $41,478 |
| Immigrants | Trinidad and Tobago | 7.9 /100 | #221 | Tragic $41,476 |
| Immigrants | Iraq | 7.1 /100 | #222 | Tragic $41,365 |
| Immigrants | Cameroon | 6.8 /100 | #223 | Tragic $41,334 |
| Immigrants | St. Vincent and the Grenadines | 6.4 /100 | #224 | Tragic $41,270 |
| West Indians | 6.0 /100 | #225 | Tragic $41,217 |
| Immigrants | Ecuador | 5.9 /100 | #226 | Tragic $41,195 |
| Immigrants | Ghana | 5.5 /100 | #227 | Tragic $41,131 |
| Immigrants | Grenada | 5.5 /100 | #228 | Tragic $41,123 |
| Nigerians | 4.9 /100 | #229 | Tragic $41,026 |
| Native Hawaiians | 4.9 /100 | #230 | Tragic $41,017 |
| Senegalese | 4.8 /100 | #231 | Tragic $41,000 |
| Guyanese | 4.5 /100 | #232 | Tragic $40,949 |
| Delaware | 3.8 /100 | #233 | Tragic $40,778 |