Scotch-Irish vs Immigrants from Ecuador Per Capita Income
COMPARE
Scotch-Irish
Immigrants from Ecuador
Per Capita Income
Per Capita Income Comparison
Scotch-Irish
Immigrants from Ecuador
$42,563
PER CAPITA INCOME
22.6/ 100
METRIC RATING
197th/ 347
METRIC RANK
$41,195
PER CAPITA INCOME
5.9/ 100
METRIC RATING
226th/ 347
METRIC RANK
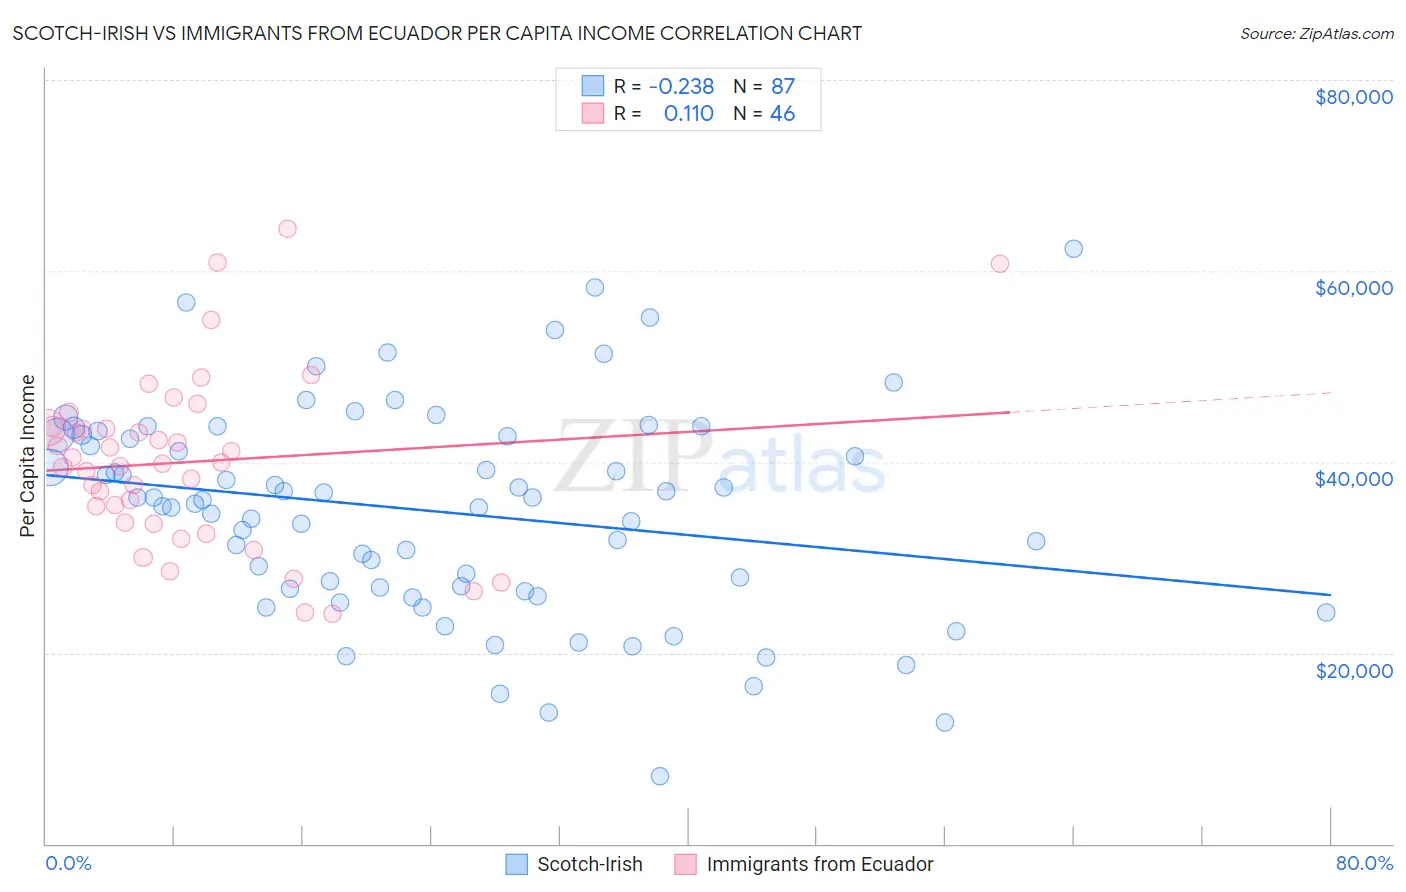
Scotch-Irish vs Immigrants from Ecuador Per Capita Income Correlation Chart
The statistical analysis conducted on geographies consisting of 548,816,006 people shows a weak negative correlation between the proportion of Scotch-Irish and per capita income in the United States with a correlation coefficient (R) of -0.238 and weighted average of $42,563. Similarly, the statistical analysis conducted on geographies consisting of 271,002,602 people shows a poor positive correlation between the proportion of Immigrants from Ecuador and per capita income in the United States with a correlation coefficient (R) of 0.110 and weighted average of $41,195, a difference of 3.3%.
Per Capita Income Correlation Summary
| Measurement | Scotch-Irish | Immigrants from Ecuador |
| Minimum | $7,124 | $24,078 |
| Maximum | $62,377 | $64,385 |
| Range | $55,253 | $40,307 |
| Mean | $34,830 | $40,002 |
| Median | $35,981 | $39,852 |
| Interquartile 25% (IQ1) | $26,689 | $33,648 |
| Interquartile 75% (IQ3) | $42,802 | $43,627 |
| Interquartile Range (IQR) | $16,113 | $9,979 |
| Standard Deviation (Sample) | $10,987 | $9,075 |
| Standard Deviation (Population) | $10,923 | $8,976 |
Similar Demographics by Per Capita Income
Demographics Similar to Scotch-Irish by Per Capita Income
In terms of per capita income, the demographic groups most similar to Scotch-Irish are Dutch ($42,605, a difference of 0.10%), Immigrants from Kenya ($42,661, a difference of 0.23%), Immigrants from Fiji ($42,694, a difference of 0.31%), Immigrants from Portugal ($42,412, a difference of 0.36%), and Barbadian ($42,406, a difference of 0.37%).
| Demographics | Rating | Rank | Per Capita Income |
| Kenyans | 27.7 /100 | #190 | Fair $42,808 |
| Yugoslavians | 27.4 /100 | #191 | Fair $42,792 |
| Iraqis | 26.7 /100 | #192 | Fair $42,760 |
| Immigrants | Sierra Leone | 26.5 /100 | #193 | Fair $42,752 |
| Immigrants | Fiji | 25.2 /100 | #194 | Fair $42,694 |
| Immigrants | Kenya | 24.5 /100 | #195 | Fair $42,661 |
| Dutch | 23.4 /100 | #196 | Fair $42,605 |
| Scotch-Irish | 22.6 /100 | #197 | Fair $42,563 |
| Immigrants | Portugal | 19.7 /100 | #198 | Poor $42,412 |
| Barbadians | 19.6 /100 | #199 | Poor $42,406 |
| Vietnamese | 19.0 /100 | #200 | Poor $42,368 |
| Immigrants | Thailand | 17.6 /100 | #201 | Poor $42,289 |
| Immigrants | Bosnia and Herzegovina | 17.5 /100 | #202 | Poor $42,278 |
| Spanish | 17.0 /100 | #203 | Poor $42,249 |
| Aleuts | 16.4 /100 | #204 | Poor $42,210 |
Demographics Similar to Immigrants from Ecuador by Per Capita Income
In terms of per capita income, the demographic groups most similar to Immigrants from Ecuador are West Indian ($41,217, a difference of 0.050%), Immigrants from Ghana ($41,131, a difference of 0.16%), Immigrants from Grenada ($41,123, a difference of 0.17%), Immigrants from St. Vincent and the Grenadines ($41,270, a difference of 0.18%), and Immigrants from Cameroon ($41,334, a difference of 0.34%).
| Demographics | Rating | Rank | Per Capita Income |
| Puget Sound Salish | 8.1 /100 | #219 | Tragic $41,495 |
| Immigrants | Barbados | 7.9 /100 | #220 | Tragic $41,478 |
| Immigrants | Trinidad and Tobago | 7.9 /100 | #221 | Tragic $41,476 |
| Immigrants | Iraq | 7.1 /100 | #222 | Tragic $41,365 |
| Immigrants | Cameroon | 6.8 /100 | #223 | Tragic $41,334 |
| Immigrants | St. Vincent and the Grenadines | 6.4 /100 | #224 | Tragic $41,270 |
| West Indians | 6.0 /100 | #225 | Tragic $41,217 |
| Immigrants | Ecuador | 5.9 /100 | #226 | Tragic $41,195 |
| Immigrants | Ghana | 5.5 /100 | #227 | Tragic $41,131 |
| Immigrants | Grenada | 5.5 /100 | #228 | Tragic $41,123 |
| Nigerians | 4.9 /100 | #229 | Tragic $41,026 |
| Native Hawaiians | 4.9 /100 | #230 | Tragic $41,017 |
| Senegalese | 4.8 /100 | #231 | Tragic $41,000 |
| Guyanese | 4.5 /100 | #232 | Tragic $40,949 |
| Delaware | 3.8 /100 | #233 | Tragic $40,778 |