Hungarian vs Immigrants from Ecuador Master's Degree
COMPARE
Hungarian
Immigrants from Ecuador
Master's Degree
Master's Degree Comparison
Hungarians
Immigrants from Ecuador
15.6%
MASTER'S DEGREE
79.1/ 100
METRIC RATING
147th/ 347
METRIC RANK
13.6%
MASTER'S DEGREE
5.7/ 100
METRIC RATING
233rd/ 347
METRIC RANK
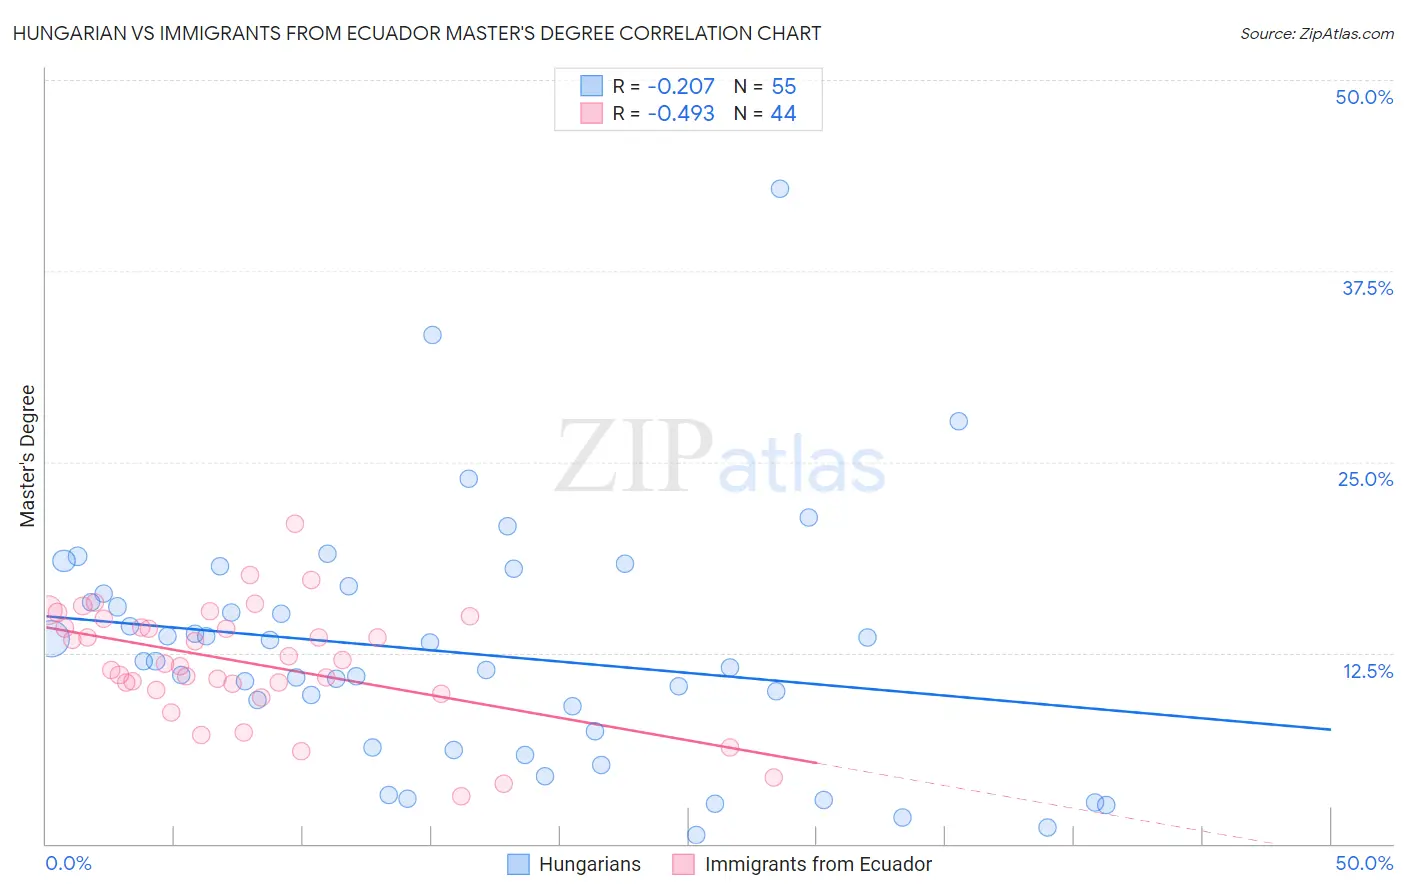
Hungarian vs Immigrants from Ecuador Master's Degree Correlation Chart
The statistical analysis conducted on geographies consisting of 485,986,149 people shows a weak negative correlation between the proportion of Hungarians and percentage of population with at least master's degree education in the United States with a correlation coefficient (R) of -0.207 and weighted average of 15.6%. Similarly, the statistical analysis conducted on geographies consisting of 270,930,295 people shows a moderate negative correlation between the proportion of Immigrants from Ecuador and percentage of population with at least master's degree education in the United States with a correlation coefficient (R) of -0.493 and weighted average of 13.6%, a difference of 14.5%.
Master's Degree Correlation Summary
| Measurement | Hungarian | Immigrants from Ecuador |
| Minimum | 0.58% | 3.1% |
| Maximum | 42.9% | 21.0% |
| Range | 42.3% | 17.9% |
| Mean | 12.5% | 11.9% |
| Median | 11.9% | 11.9% |
| Interquartile 25% (IQ1) | 6.3% | 10.2% |
| Interquartile 75% (IQ3) | 16.4% | 14.4% |
| Interquartile Range (IQR) | 10.1% | 4.2% |
| Standard Deviation (Sample) | 8.0% | 3.8% |
| Standard Deviation (Population) | 7.9% | 3.7% |
Similar Demographics by Master's Degree
Demographics Similar to Hungarians by Master's Degree
In terms of master's degree, the demographic groups most similar to Hungarians are Immigrants from Afghanistan (15.6%, a difference of 0.040%), Immigrants from Senegal (15.5%, a difference of 0.17%), Ghanaian (15.5%, a difference of 0.18%), Slovene (15.5%, a difference of 0.21%), and Iraqi (15.5%, a difference of 0.33%).
| Demographics | Rating | Rank | Master's Degree |
| Vietnamese | 85.5 /100 | #140 | Excellent 15.8% |
| Poles | 85.0 /100 | #141 | Excellent 15.7% |
| Immigrants | Africa | 84.0 /100 | #142 | Excellent 15.7% |
| Immigrants | Venezuela | 83.6 /100 | #143 | Excellent 15.7% |
| Canadians | 83.3 /100 | #144 | Excellent 15.7% |
| South Americans | 81.3 /100 | #145 | Excellent 15.6% |
| Immigrants | Afghanistan | 79.4 /100 | #146 | Good 15.6% |
| Hungarians | 79.1 /100 | #147 | Good 15.6% |
| Immigrants | Senegal | 78.2 /100 | #148 | Good 15.5% |
| Ghanaians | 78.2 /100 | #149 | Good 15.5% |
| Slovenes | 78.0 /100 | #150 | Good 15.5% |
| Iraqis | 77.3 /100 | #151 | Good 15.5% |
| Slavs | 77.0 /100 | #152 | Good 15.5% |
| Icelanders | 76.8 /100 | #153 | Good 15.5% |
| Immigrants | South America | 76.3 /100 | #154 | Good 15.5% |
Demographics Similar to Immigrants from Ecuador by Master's Degree
In terms of master's degree, the demographic groups most similar to Immigrants from Ecuador are Immigrants from Philippines (13.6%, a difference of 0.15%), Immigrants from Burma/Myanmar (13.5%, a difference of 0.50%), German Russian (13.5%, a difference of 0.91%), Immigrants from Guyana (13.4%, a difference of 1.0%), and Guyanese (13.7%, a difference of 1.0%).
| Demographics | Rating | Rank | Master's Degree |
| Immigrants | St. Vincent and the Grenadines | 11.0 /100 | #226 | Poor 13.9% |
| Immigrants | West Indies | 9.8 /100 | #227 | Tragic 13.9% |
| Whites/Caucasians | 9.1 /100 | #228 | Tragic 13.8% |
| British West Indians | 8.8 /100 | #229 | Tragic 13.8% |
| Dutch | 8.7 /100 | #230 | Tragic 13.8% |
| Guyanese | 7.6 /100 | #231 | Tragic 13.7% |
| Immigrants | Philippines | 6.0 /100 | #232 | Tragic 13.6% |
| Immigrants | Ecuador | 5.7 /100 | #233 | Tragic 13.6% |
| Immigrants | Burma/Myanmar | 5.0 /100 | #234 | Tragic 13.5% |
| German Russians | 4.5 /100 | #235 | Tragic 13.5% |
| Immigrants | Guyana | 4.4 /100 | #236 | Tragic 13.4% |
| Jamaicans | 4.1 /100 | #237 | Tragic 13.4% |
| Hmong | 4.0 /100 | #238 | Tragic 13.4% |
| Immigrants | Nonimmigrants | 3.4 /100 | #239 | Tragic 13.3% |
| Guamanians/Chamorros | 2.2 /100 | #240 | Tragic 13.1% |