Cree vs Immigrants from Ecuador Per Capita Income
COMPARE
Cree
Immigrants from Ecuador
Per Capita Income
Per Capita Income Comparison
Cree
Immigrants from Ecuador
$40,056
PER CAPITA INCOME
1.7/ 100
METRIC RATING
246th/ 347
METRIC RANK
$41,195
PER CAPITA INCOME
5.9/ 100
METRIC RATING
226th/ 347
METRIC RANK
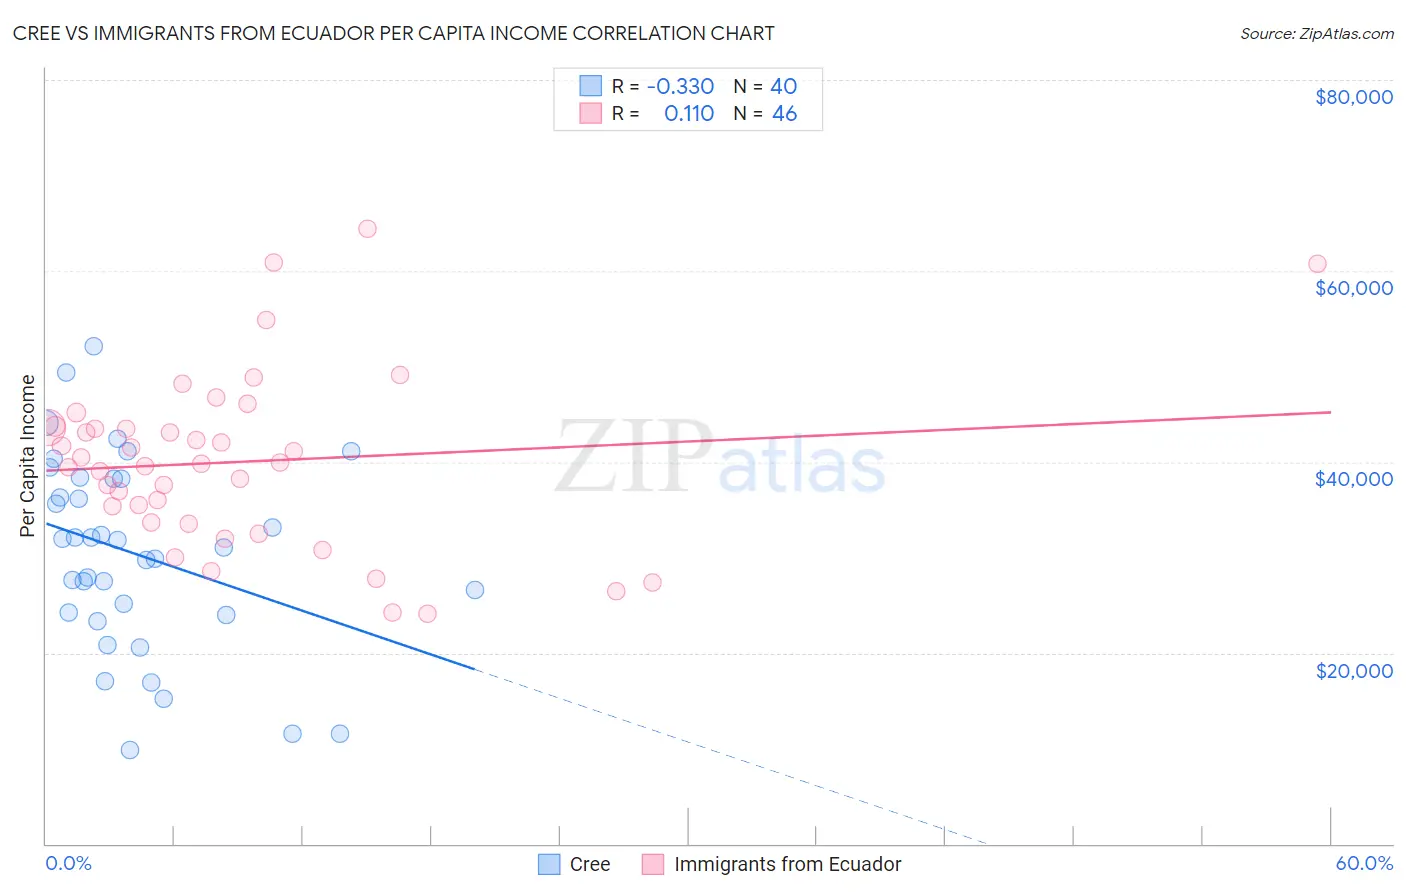
Cree vs Immigrants from Ecuador Per Capita Income Correlation Chart
The statistical analysis conducted on geographies consisting of 76,211,685 people shows a mild negative correlation between the proportion of Cree and per capita income in the United States with a correlation coefficient (R) of -0.330 and weighted average of $40,056. Similarly, the statistical analysis conducted on geographies consisting of 271,002,602 people shows a poor positive correlation between the proportion of Immigrants from Ecuador and per capita income in the United States with a correlation coefficient (R) of 0.110 and weighted average of $41,195, a difference of 2.8%.
Per Capita Income Correlation Summary
| Measurement | Cree | Immigrants from Ecuador |
| Minimum | $9,879 | $24,078 |
| Maximum | $52,079 | $64,385 |
| Range | $42,200 | $40,307 |
| Mean | $30,350 | $40,002 |
| Median | $31,398 | $39,852 |
| Interquartile 25% (IQ1) | $24,114 | $33,648 |
| Interquartile 75% (IQ3) | $38,235 | $43,627 |
| Interquartile Range (IQR) | $14,121 | $9,979 |
| Standard Deviation (Sample) | $10,115 | $9,075 |
| Standard Deviation (Population) | $9,988 | $8,976 |
Demographics Similar to Cree and Immigrants from Ecuador by Per Capita Income
In terms of per capita income, the demographic groups most similar to Cree are Subsaharan African ($40,152, a difference of 0.24%), French American Indian ($40,244, a difference of 0.47%), German Russian ($40,266, a difference of 0.53%), Immigrants from Western Africa ($40,294, a difference of 0.60%), and British West Indian ($40,330, a difference of 0.68%). Similarly, the demographic groups most similar to Immigrants from Ecuador are Immigrants from Ghana ($41,131, a difference of 0.16%), Immigrants from Grenada ($41,123, a difference of 0.17%), Nigerian ($41,026, a difference of 0.41%), Native Hawaiian ($41,017, a difference of 0.43%), and Senegalese ($41,000, a difference of 0.47%).
| Demographics | Rating | Rank | Per Capita Income |
| Immigrants | Ecuador | 5.9 /100 | #226 | Tragic $41,195 |
| Immigrants | Ghana | 5.5 /100 | #227 | Tragic $41,131 |
| Immigrants | Grenada | 5.5 /100 | #228 | Tragic $41,123 |
| Nigerians | 4.9 /100 | #229 | Tragic $41,026 |
| Native Hawaiians | 4.9 /100 | #230 | Tragic $41,017 |
| Senegalese | 4.8 /100 | #231 | Tragic $41,000 |
| Guyanese | 4.5 /100 | #232 | Tragic $40,949 |
| Delaware | 3.8 /100 | #233 | Tragic $40,778 |
| Immigrants | West Indies | 3.7 /100 | #234 | Tragic $40,763 |
| Immigrants | Guyana | 3.6 /100 | #235 | Tragic $40,742 |
| Immigrants | Nonimmigrants | 3.4 /100 | #236 | Tragic $40,669 |
| Immigrants | Cambodia | 2.6 /100 | #237 | Tragic $40,434 |
| Somalis | 2.4 /100 | #238 | Tragic $40,367 |
| Tsimshian | 2.4 /100 | #239 | Tragic $40,344 |
| Immigrants | Nigeria | 2.3 /100 | #240 | Tragic $40,339 |
| British West Indians | 2.3 /100 | #241 | Tragic $40,330 |
| Immigrants | Western Africa | 2.2 /100 | #242 | Tragic $40,294 |
| German Russians | 2.2 /100 | #243 | Tragic $40,266 |
| French American Indians | 2.1 /100 | #244 | Tragic $40,244 |
| Sub-Saharan Africans | 1.9 /100 | #245 | Tragic $40,152 |
| Cree | 1.7 /100 | #246 | Tragic $40,056 |