Immigrants from Nicaragua vs Jamaican Median Female Earnings
COMPARE
Immigrants from Nicaragua
Jamaican
Median Female Earnings
Median Female Earnings Comparison
Immigrants from Nicaragua
Jamaicans
$36,023
MEDIAN FEMALE EARNINGS
0.0/ 100
METRIC RATING
287th/ 347
METRIC RANK
$38,670
MEDIAN FEMALE EARNINGS
10.5/ 100
METRIC RATING
213th/ 347
METRIC RANK
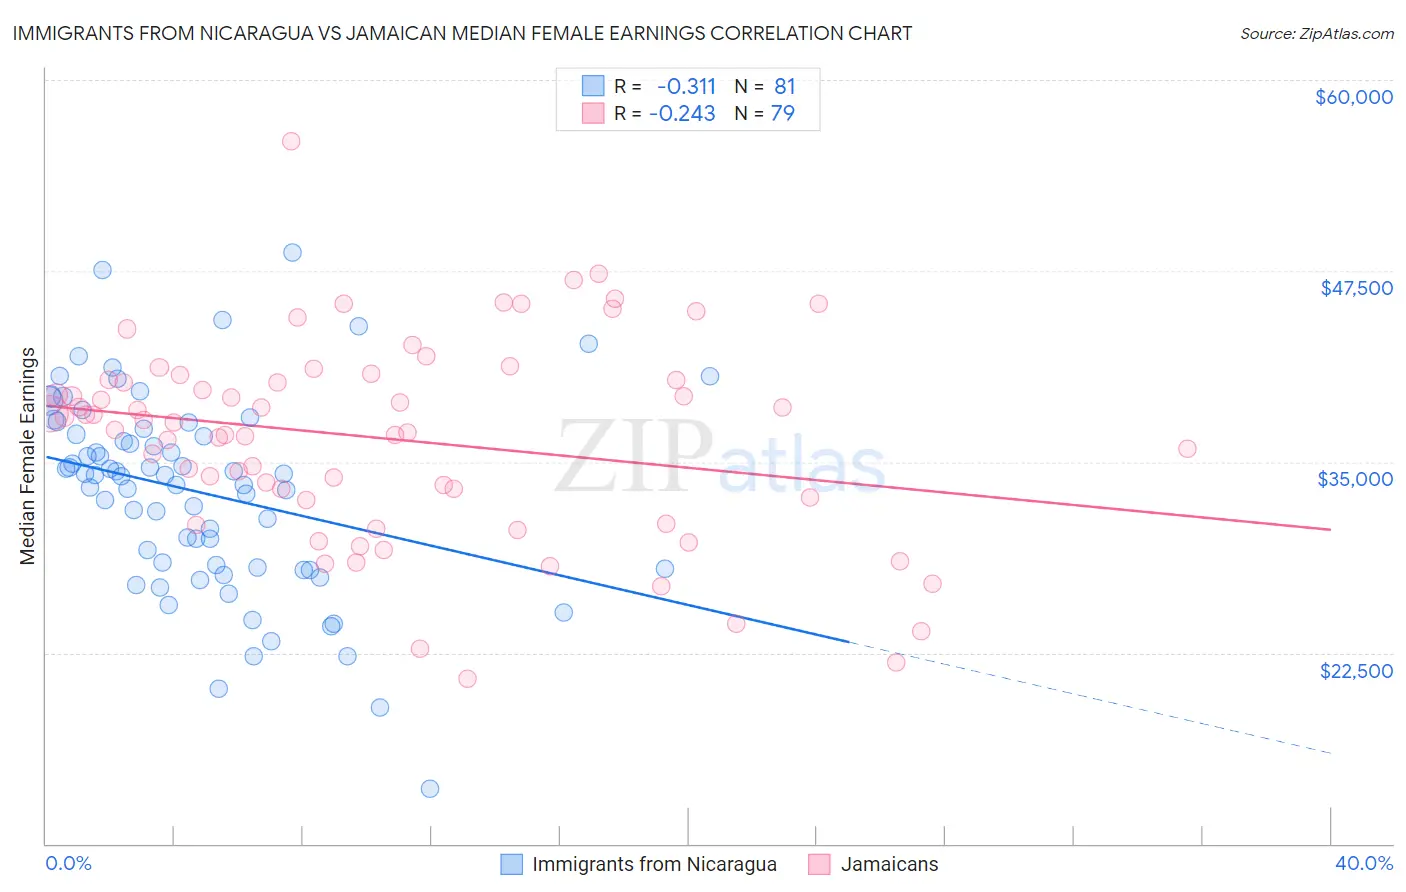
Immigrants from Nicaragua vs Jamaican Median Female Earnings Correlation Chart
The statistical analysis conducted on geographies consisting of 236,298,559 people shows a mild negative correlation between the proportion of Immigrants from Nicaragua and median female earnings in the United States with a correlation coefficient (R) of -0.311 and weighted average of $36,023. Similarly, the statistical analysis conducted on geographies consisting of 367,929,945 people shows a weak negative correlation between the proportion of Jamaicans and median female earnings in the United States with a correlation coefficient (R) of -0.243 and weighted average of $38,670, a difference of 7.3%.
Median Female Earnings Correlation Summary
| Measurement | Immigrants from Nicaragua | Jamaican |
| Minimum | $13,608 | $20,833 |
| Maximum | $48,676 | $56,012 |
| Range | $35,068 | $35,179 |
| Mean | $32,980 | $36,507 |
| Median | $34,129 | $37,552 |
| Interquartile 25% (IQ1) | $28,072 | $32,539 |
| Interquartile 75% (IQ3) | $36,975 | $40,387 |
| Interquartile Range (IQR) | $8,904 | $7,848 |
| Standard Deviation (Sample) | $6,452 | $6,597 |
| Standard Deviation (Population) | $6,412 | $6,555 |
Similar Demographics by Median Female Earnings
Demographics Similar to Immigrants from Nicaragua by Median Female Earnings
In terms of median female earnings, the demographic groups most similar to Immigrants from Nicaragua are Immigrants from Zaire ($36,017, a difference of 0.020%), Osage ($36,034, a difference of 0.030%), Paiute ($36,056, a difference of 0.090%), Bangladeshi ($35,960, a difference of 0.17%), and Central American Indian ($35,930, a difference of 0.26%).
| Demographics | Rating | Rank | Median Female Earnings |
| Iroquois | 0.1 /100 | #280 | Tragic $36,408 |
| Spanish Americans | 0.1 /100 | #281 | Tragic $36,391 |
| Haitians | 0.1 /100 | #282 | Tragic $36,374 |
| Immigrants | Haiti | 0.1 /100 | #283 | Tragic $36,203 |
| Indonesians | 0.1 /100 | #284 | Tragic $36,140 |
| Paiute | 0.1 /100 | #285 | Tragic $36,056 |
| Osage | 0.0 /100 | #286 | Tragic $36,034 |
| Immigrants | Nicaragua | 0.0 /100 | #287 | Tragic $36,023 |
| Immigrants | Zaire | 0.0 /100 | #288 | Tragic $36,017 |
| Bangladeshis | 0.0 /100 | #289 | Tragic $35,960 |
| Central American Indians | 0.0 /100 | #290 | Tragic $35,930 |
| Blackfeet | 0.0 /100 | #291 | Tragic $35,864 |
| Americans | 0.0 /100 | #292 | Tragic $35,777 |
| Guatemalans | 0.0 /100 | #293 | Tragic $35,695 |
| Cheyenne | 0.0 /100 | #294 | Tragic $35,673 |
Demographics Similar to Jamaicans by Median Female Earnings
In terms of median female earnings, the demographic groups most similar to Jamaicans are Iraqi ($38,666, a difference of 0.010%), Spaniard ($38,656, a difference of 0.030%), Immigrants from Ecuador ($38,644, a difference of 0.070%), Guamanian/Chamorro ($38,717, a difference of 0.12%), and Immigrants from Jamaica ($38,625, a difference of 0.12%).
| Demographics | Rating | Rank | Median Female Earnings |
| Immigrants | Bosnia and Herzegovina | 15.6 /100 | #206 | Poor $38,886 |
| Immigrants | Cambodia | 14.2 /100 | #207 | Poor $38,833 |
| Immigrants | Thailand | 13.6 /100 | #208 | Poor $38,810 |
| Norwegians | 13.4 /100 | #209 | Poor $38,802 |
| Czechoslovakians | 12.0 /100 | #210 | Poor $38,738 |
| Aleuts | 11.6 /100 | #211 | Poor $38,719 |
| Guamanians/Chamorros | 11.5 /100 | #212 | Poor $38,717 |
| Jamaicans | 10.5 /100 | #213 | Poor $38,670 |
| Iraqis | 10.5 /100 | #214 | Poor $38,666 |
| Spaniards | 10.3 /100 | #215 | Poor $38,656 |
| Immigrants | Ecuador | 10.1 /100 | #216 | Poor $38,644 |
| Immigrants | Jamaica | 9.7 /100 | #217 | Tragic $38,625 |
| Cape Verdeans | 9.5 /100 | #218 | Tragic $38,614 |
| Nepalese | 9.3 /100 | #219 | Tragic $38,603 |
| Yugoslavians | 8.8 /100 | #220 | Tragic $38,573 |