Polish vs Jamaican Median Female Earnings
COMPARE
Polish
Jamaican
Median Female Earnings
Median Female Earnings Comparison
Poles
Jamaicans
$40,371
MEDIAN FEMALE EARNINGS
80.2/ 100
METRIC RATING
148th/ 347
METRIC RANK
$38,670
MEDIAN FEMALE EARNINGS
10.5/ 100
METRIC RATING
213th/ 347
METRIC RANK
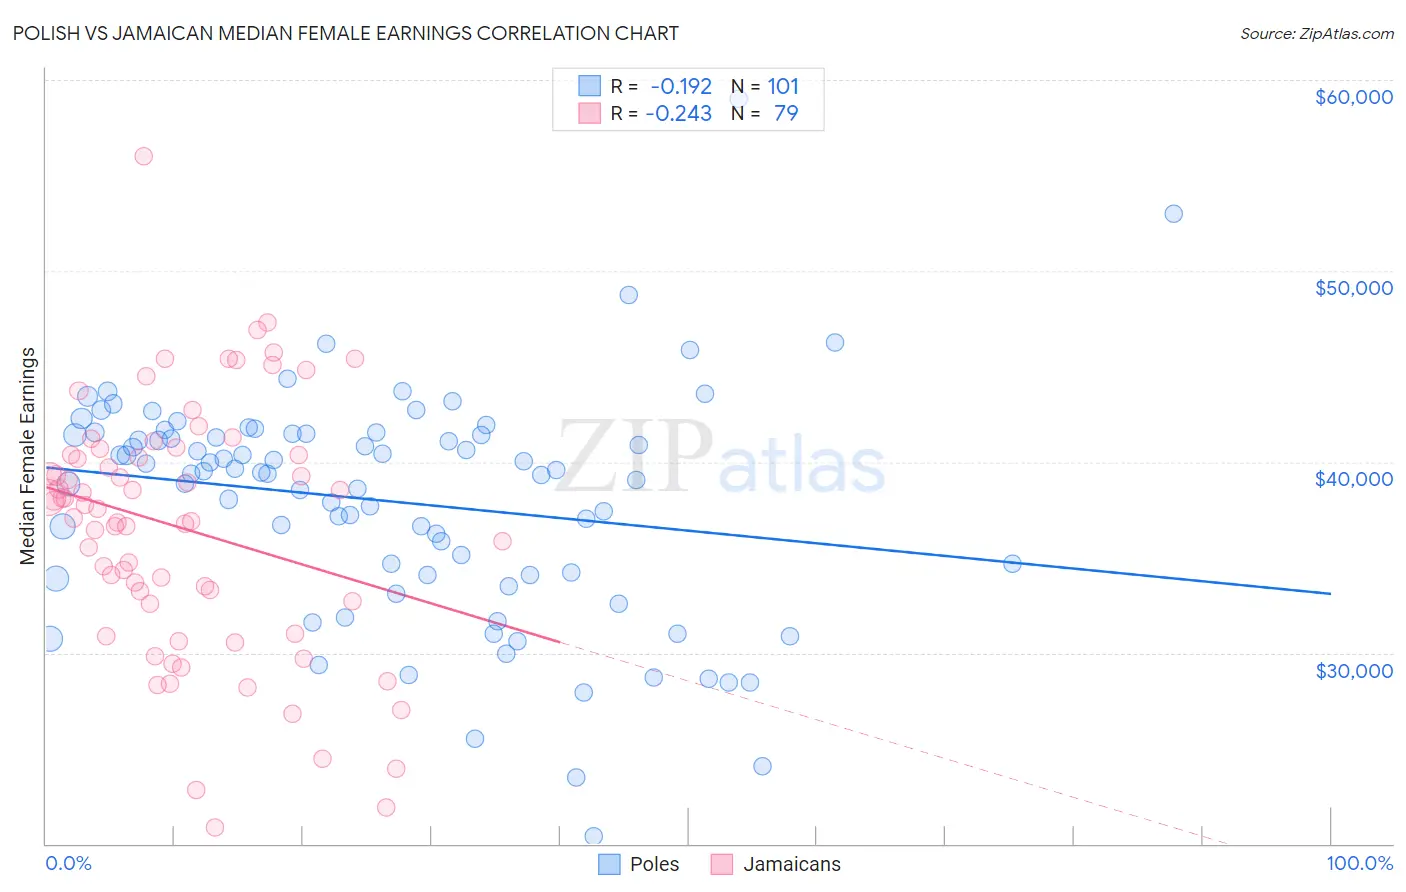
Polish vs Jamaican Median Female Earnings Correlation Chart
The statistical analysis conducted on geographies consisting of 559,155,660 people shows a poor negative correlation between the proportion of Poles and median female earnings in the United States with a correlation coefficient (R) of -0.192 and weighted average of $40,371. Similarly, the statistical analysis conducted on geographies consisting of 367,929,945 people shows a weak negative correlation between the proportion of Jamaicans and median female earnings in the United States with a correlation coefficient (R) of -0.243 and weighted average of $38,670, a difference of 4.4%.
Median Female Earnings Correlation Summary
| Measurement | Polish | Jamaican |
| Minimum | $20,398 | $20,833 |
| Maximum | $59,044 | $56,012 |
| Range | $38,646 | $35,179 |
| Mean | $37,935 | $36,507 |
| Median | $39,430 | $37,552 |
| Interquartile 25% (IQ1) | $34,072 | $32,539 |
| Interquartile 75% (IQ3) | $41,456 | $40,387 |
| Interquartile Range (IQR) | $7,385 | $7,848 |
| Standard Deviation (Sample) | $6,072 | $6,597 |
| Standard Deviation (Population) | $6,042 | $6,555 |
Similar Demographics by Median Female Earnings
Demographics Similar to Poles by Median Female Earnings
In terms of median female earnings, the demographic groups most similar to Poles are Vietnamese ($40,377, a difference of 0.020%), Immigrants from Cameroon ($40,354, a difference of 0.040%), Immigrants from Chile ($40,353, a difference of 0.040%), Immigrants from Armenia ($40,340, a difference of 0.080%), and West Indian ($40,317, a difference of 0.13%).
| Demographics | Rating | Rank | Median Female Earnings |
| Immigrants | Syria | 84.1 /100 | #141 | Excellent $40,499 |
| Sri Lankans | 84.0 /100 | #142 | Excellent $40,496 |
| Northern Europeans | 83.9 /100 | #143 | Excellent $40,491 |
| Immigrants | North Macedonia | 83.8 /100 | #144 | Excellent $40,488 |
| Brazilians | 83.6 /100 | #145 | Excellent $40,483 |
| Ghanaians | 82.1 /100 | #146 | Excellent $40,429 |
| Vietnamese | 80.4 /100 | #147 | Excellent $40,377 |
| Poles | 80.2 /100 | #148 | Excellent $40,371 |
| Immigrants | Cameroon | 79.7 /100 | #149 | Good $40,354 |
| Immigrants | Chile | 79.6 /100 | #150 | Good $40,353 |
| Immigrants | Armenia | 79.2 /100 | #151 | Good $40,340 |
| West Indians | 78.4 /100 | #152 | Good $40,317 |
| British West Indians | 77.7 /100 | #153 | Good $40,299 |
| Immigrants | Oceania | 77.6 /100 | #154 | Good $40,297 |
| Immigrants | Africa | 76.2 /100 | #155 | Good $40,257 |
Demographics Similar to Jamaicans by Median Female Earnings
In terms of median female earnings, the demographic groups most similar to Jamaicans are Iraqi ($38,666, a difference of 0.010%), Spaniard ($38,656, a difference of 0.030%), Immigrants from Ecuador ($38,644, a difference of 0.070%), Guamanian/Chamorro ($38,717, a difference of 0.12%), and Immigrants from Jamaica ($38,625, a difference of 0.12%).
| Demographics | Rating | Rank | Median Female Earnings |
| Immigrants | Bosnia and Herzegovina | 15.6 /100 | #206 | Poor $38,886 |
| Immigrants | Cambodia | 14.2 /100 | #207 | Poor $38,833 |
| Immigrants | Thailand | 13.6 /100 | #208 | Poor $38,810 |
| Norwegians | 13.4 /100 | #209 | Poor $38,802 |
| Czechoslovakians | 12.0 /100 | #210 | Poor $38,738 |
| Aleuts | 11.6 /100 | #211 | Poor $38,719 |
| Guamanians/Chamorros | 11.5 /100 | #212 | Poor $38,717 |
| Jamaicans | 10.5 /100 | #213 | Poor $38,670 |
| Iraqis | 10.5 /100 | #214 | Poor $38,666 |
| Spaniards | 10.3 /100 | #215 | Poor $38,656 |
| Immigrants | Ecuador | 10.1 /100 | #216 | Poor $38,644 |
| Immigrants | Jamaica | 9.7 /100 | #217 | Tragic $38,625 |
| Cape Verdeans | 9.5 /100 | #218 | Tragic $38,614 |
| Nepalese | 9.3 /100 | #219 | Tragic $38,603 |
| Yugoslavians | 8.8 /100 | #220 | Tragic $38,573 |