Ethiopian vs Jamaican Median Female Earnings
COMPARE
Ethiopian
Jamaican
Median Female Earnings
Median Female Earnings Comparison
Ethiopians
Jamaicans
$43,243
MEDIAN FEMALE EARNINGS
99.9/ 100
METRIC RATING
57th/ 347
METRIC RANK
$38,670
MEDIAN FEMALE EARNINGS
10.5/ 100
METRIC RATING
213th/ 347
METRIC RANK
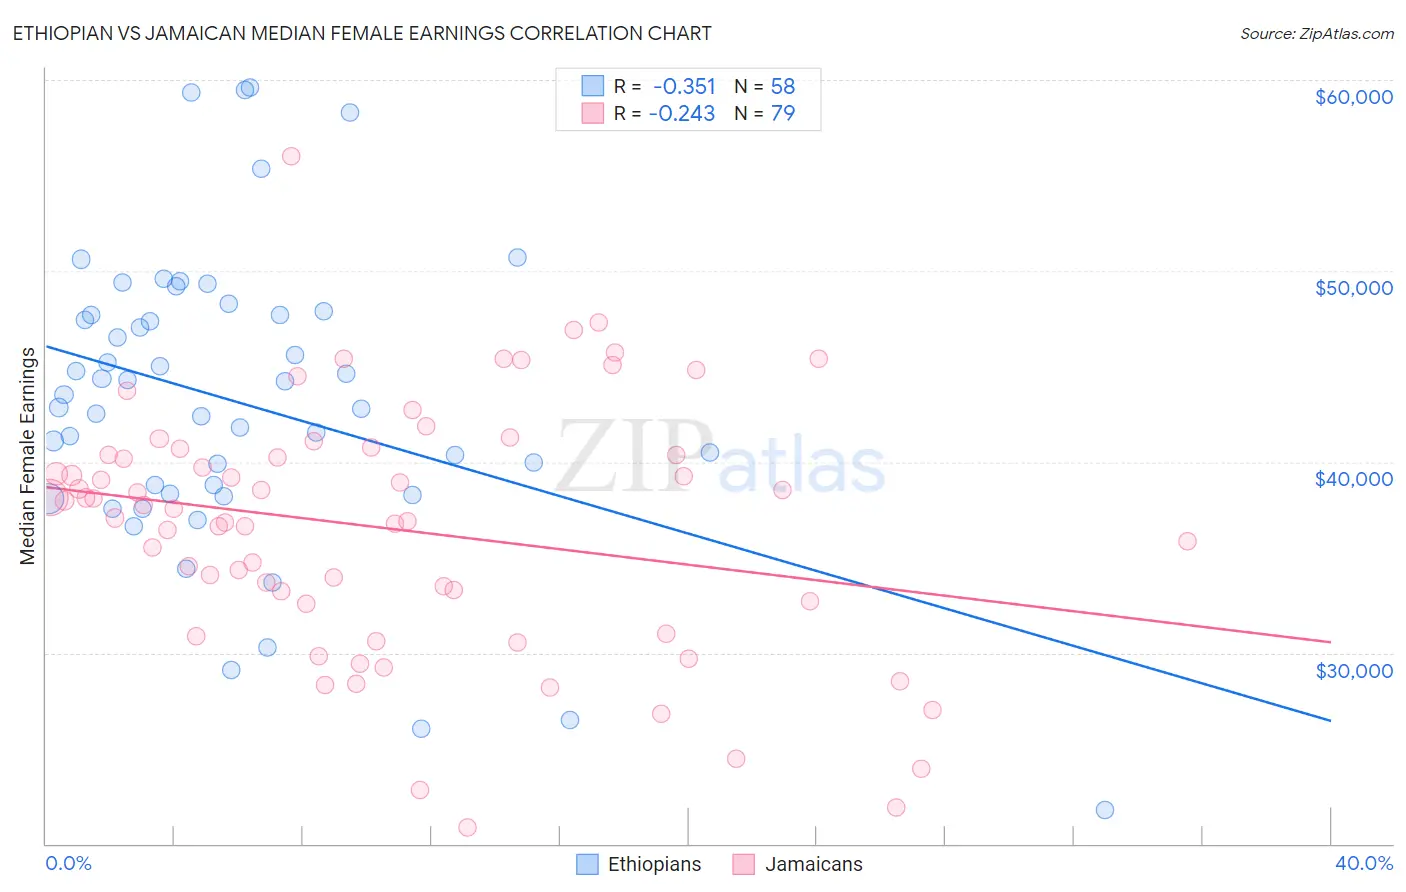
Ethiopian vs Jamaican Median Female Earnings Correlation Chart
The statistical analysis conducted on geographies consisting of 223,241,748 people shows a mild negative correlation between the proportion of Ethiopians and median female earnings in the United States with a correlation coefficient (R) of -0.351 and weighted average of $43,243. Similarly, the statistical analysis conducted on geographies consisting of 367,929,945 people shows a weak negative correlation between the proportion of Jamaicans and median female earnings in the United States with a correlation coefficient (R) of -0.243 and weighted average of $38,670, a difference of 11.8%.
Median Female Earnings Correlation Summary
| Measurement | Ethiopian | Jamaican |
| Minimum | $21,797 | $20,833 |
| Maximum | $59,585 | $56,012 |
| Range | $37,788 | $35,179 |
| Mean | $43,098 | $36,507 |
| Median | $43,184 | $37,552 |
| Interquartile 25% (IQ1) | $38,309 | $32,539 |
| Interquartile 75% (IQ3) | $47,681 | $40,387 |
| Interquartile Range (IQR) | $9,372 | $7,848 |
| Standard Deviation (Sample) | $7,882 | $6,597 |
| Standard Deviation (Population) | $7,814 | $6,555 |
Similar Demographics by Median Female Earnings
Demographics Similar to Ethiopians by Median Female Earnings
In terms of median female earnings, the demographic groups most similar to Ethiopians are Immigrants from Croatia ($43,258, a difference of 0.040%), Egyptian ($43,305, a difference of 0.14%), Immigrants from Eastern Europe ($43,309, a difference of 0.15%), Australian ($43,308, a difference of 0.15%), and Paraguayan ($43,173, a difference of 0.16%).
| Demographics | Rating | Rank | Median Female Earnings |
| Immigrants | Uzbekistan | 100.0 /100 | #50 | Exceptional $43,363 |
| Maltese | 100.0 /100 | #51 | Exceptional $43,357 |
| Immigrants | Lithuania | 99.9 /100 | #52 | Exceptional $43,317 |
| Immigrants | Eastern Europe | 99.9 /100 | #53 | Exceptional $43,309 |
| Australians | 99.9 /100 | #54 | Exceptional $43,308 |
| Egyptians | 99.9 /100 | #55 | Exceptional $43,305 |
| Immigrants | Croatia | 99.9 /100 | #56 | Exceptional $43,258 |
| Ethiopians | 99.9 /100 | #57 | Exceptional $43,243 |
| Paraguayans | 99.9 /100 | #58 | Exceptional $43,173 |
| Estonians | 99.9 /100 | #59 | Exceptional $43,106 |
| Immigrants | Latvia | 99.9 /100 | #60 | Exceptional $43,099 |
| Immigrants | Bulgaria | 99.9 /100 | #61 | Exceptional $43,085 |
| Afghans | 99.9 /100 | #62 | Exceptional $43,077 |
| Immigrants | Ukraine | 99.9 /100 | #63 | Exceptional $43,069 |
| Immigrants | Pakistan | 99.9 /100 | #64 | Exceptional $43,052 |
Demographics Similar to Jamaicans by Median Female Earnings
In terms of median female earnings, the demographic groups most similar to Jamaicans are Iraqi ($38,666, a difference of 0.010%), Spaniard ($38,656, a difference of 0.030%), Immigrants from Ecuador ($38,644, a difference of 0.070%), Guamanian/Chamorro ($38,717, a difference of 0.12%), and Immigrants from Jamaica ($38,625, a difference of 0.12%).
| Demographics | Rating | Rank | Median Female Earnings |
| Immigrants | Bosnia and Herzegovina | 15.6 /100 | #206 | Poor $38,886 |
| Immigrants | Cambodia | 14.2 /100 | #207 | Poor $38,833 |
| Immigrants | Thailand | 13.6 /100 | #208 | Poor $38,810 |
| Norwegians | 13.4 /100 | #209 | Poor $38,802 |
| Czechoslovakians | 12.0 /100 | #210 | Poor $38,738 |
| Aleuts | 11.6 /100 | #211 | Poor $38,719 |
| Guamanians/Chamorros | 11.5 /100 | #212 | Poor $38,717 |
| Jamaicans | 10.5 /100 | #213 | Poor $38,670 |
| Iraqis | 10.5 /100 | #214 | Poor $38,666 |
| Spaniards | 10.3 /100 | #215 | Poor $38,656 |
| Immigrants | Ecuador | 10.1 /100 | #216 | Poor $38,644 |
| Immigrants | Jamaica | 9.7 /100 | #217 | Tragic $38,625 |
| Cape Verdeans | 9.5 /100 | #218 | Tragic $38,614 |
| Nepalese | 9.3 /100 | #219 | Tragic $38,603 |
| Yugoslavians | 8.8 /100 | #220 | Tragic $38,573 |