Houma vs Jamaican 9th Grade
COMPARE
Houma
Jamaican
9th Grade
9th Grade Comparison
Houma
Jamaicans
92.3%
9TH GRADE
0.0/ 100
METRIC RATING
312th/ 347
METRIC RANK
94.1%
9TH GRADE
1.0/ 100
METRIC RATING
251st/ 347
METRIC RANK
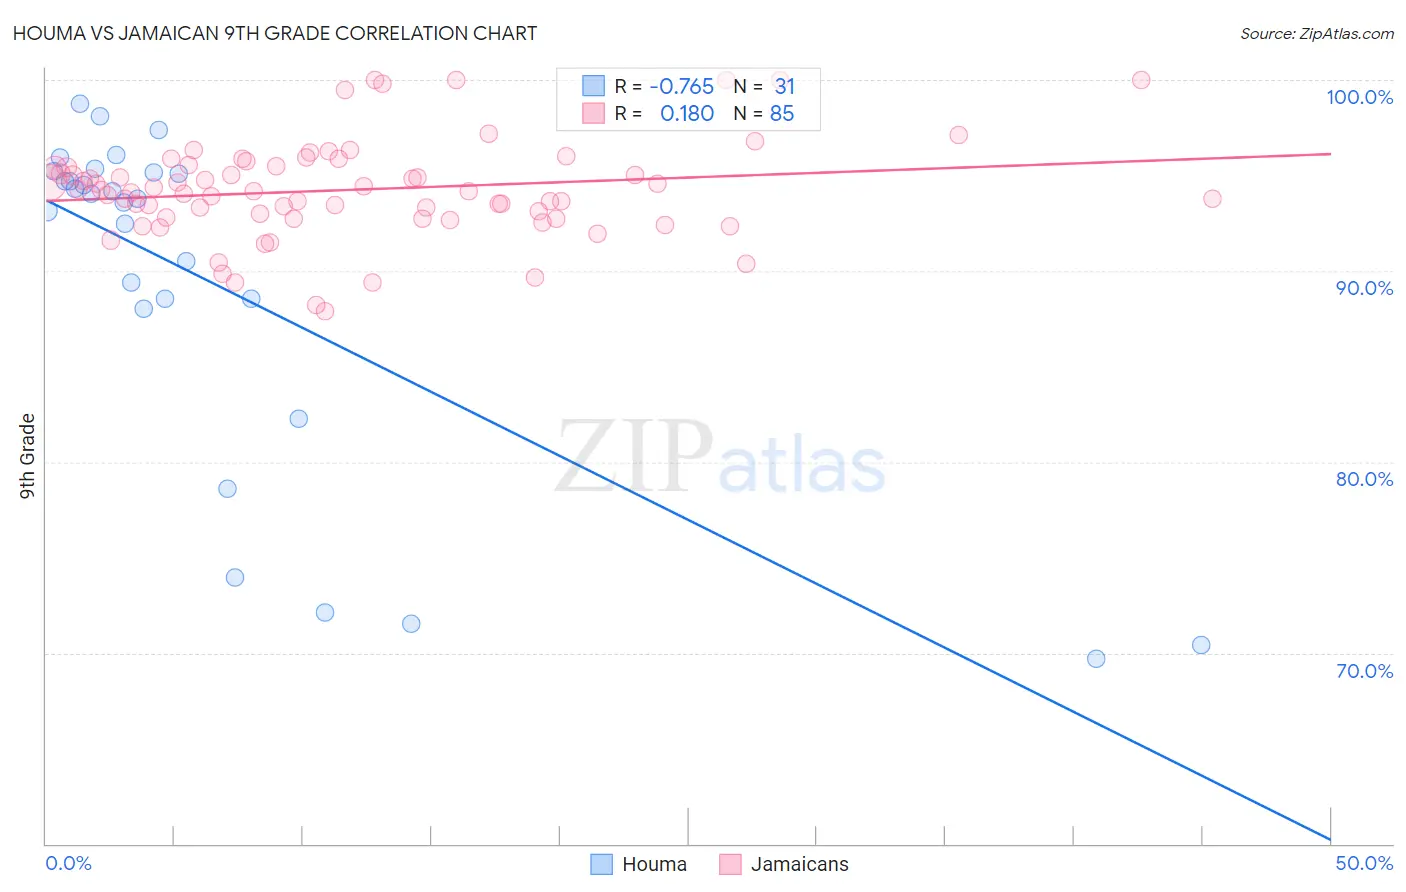
Houma vs Jamaican 9th Grade Correlation Chart
The statistical analysis conducted on geographies consisting of 36,795,916 people shows a strong negative correlation between the proportion of Houma and percentage of population with at least 9th grade education in the United States with a correlation coefficient (R) of -0.765 and weighted average of 92.3%. Similarly, the statistical analysis conducted on geographies consisting of 368,084,732 people shows a poor positive correlation between the proportion of Jamaicans and percentage of population with at least 9th grade education in the United States with a correlation coefficient (R) of 0.180 and weighted average of 94.1%, a difference of 1.9%.
9th Grade Correlation Summary
| Measurement | Houma | Jamaican |
| Minimum | 69.7% | 87.9% |
| Maximum | 98.8% | 100.0% |
| Range | 29.0% | 12.1% |
| Mean | 89.4% | 94.2% |
| Median | 93.8% | 94.2% |
| Interquartile 25% (IQ1) | 88.0% | 92.8% |
| Interquartile 75% (IQ3) | 95.1% | 95.5% |
| Interquartile Range (IQR) | 7.1% | 2.8% |
| Standard Deviation (Sample) | 9.0% | 2.6% |
| Standard Deviation (Population) | 8.9% | 2.5% |
Similar Demographics by 9th Grade
Demographics Similar to Houma by 9th Grade
In terms of 9th grade, the demographic groups most similar to Houma are Vietnamese (92.3%, a difference of 0.020%), Immigrants from Fiji (92.3%, a difference of 0.030%), Immigrants from Cambodia (92.4%, a difference of 0.060%), Immigrants from Portugal (92.2%, a difference of 0.060%), and Immigrants from Caribbean (92.2%, a difference of 0.070%).
| Demographics | Rating | Rank | 9th Grade |
| Japanese | 0.0 /100 | #305 | Tragic 92.6% |
| Immigrants | Vietnam | 0.0 /100 | #306 | Tragic 92.6% |
| Immigrants | Immigrants | 0.0 /100 | #307 | Tragic 92.5% |
| Immigrants | Guyana | 0.0 /100 | #308 | Tragic 92.5% |
| Immigrants | Bangladesh | 0.0 /100 | #309 | Tragic 92.4% |
| Immigrants | Cambodia | 0.0 /100 | #310 | Tragic 92.4% |
| Immigrants | Fiji | 0.0 /100 | #311 | Tragic 92.3% |
| Houma | 0.0 /100 | #312 | Tragic 92.3% |
| Vietnamese | 0.0 /100 | #313 | Tragic 92.3% |
| Immigrants | Portugal | 0.0 /100 | #314 | Tragic 92.2% |
| Immigrants | Caribbean | 0.0 /100 | #315 | Tragic 92.2% |
| Cape Verdeans | 0.0 /100 | #316 | Tragic 92.2% |
| Immigrants | Cuba | 0.0 /100 | #317 | Tragic 92.2% |
| Nepalese | 0.0 /100 | #318 | Tragic 92.0% |
| Ecuadorians | 0.0 /100 | #319 | Tragic 91.9% |
Demographics Similar to Jamaicans by 9th Grade
In terms of 9th grade, the demographic groups most similar to Jamaicans are Immigrants from Senegal (94.1%, a difference of 0.010%), Colombian (94.0%, a difference of 0.030%), Uruguayan (94.1%, a difference of 0.060%), Immigrants from Hong Kong (94.1%, a difference of 0.060%), and U.S. Virgin Islander (94.0%, a difference of 0.060%).
| Demographics | Rating | Rank | 9th Grade |
| Dutch West Indians | 2.0 /100 | #244 | Tragic 94.2% |
| Paiute | 1.9 /100 | #245 | Tragic 94.2% |
| Senegalese | 1.9 /100 | #246 | Tragic 94.2% |
| Afghans | 1.8 /100 | #247 | Tragic 94.2% |
| Immigrants | Somalia | 1.4 /100 | #248 | Tragic 94.1% |
| Uruguayans | 1.3 /100 | #249 | Tragic 94.1% |
| Immigrants | Hong Kong | 1.3 /100 | #250 | Tragic 94.1% |
| Jamaicans | 1.0 /100 | #251 | Tragic 94.1% |
| Immigrants | Senegal | 0.9 /100 | #252 | Tragic 94.1% |
| Colombians | 0.8 /100 | #253 | Tragic 94.0% |
| U.S. Virgin Islanders | 0.7 /100 | #254 | Tragic 94.0% |
| Immigrants | Nigeria | 0.6 /100 | #255 | Tragic 94.0% |
| Immigrants | Afghanistan | 0.5 /100 | #256 | Tragic 94.0% |
| Immigrants | Costa Rica | 0.5 /100 | #257 | Tragic 94.0% |
| Immigrants | Thailand | 0.5 /100 | #258 | Tragic 93.9% |