Chickasaw vs Jamaican Median Female Earnings
COMPARE
Chickasaw
Jamaican
Median Female Earnings
Median Female Earnings Comparison
Chickasaw
Jamaicans
$34,414
MEDIAN FEMALE EARNINGS
0.0/ 100
METRIC RATING
322nd/ 347
METRIC RANK
$38,670
MEDIAN FEMALE EARNINGS
10.5/ 100
METRIC RATING
213th/ 347
METRIC RANK
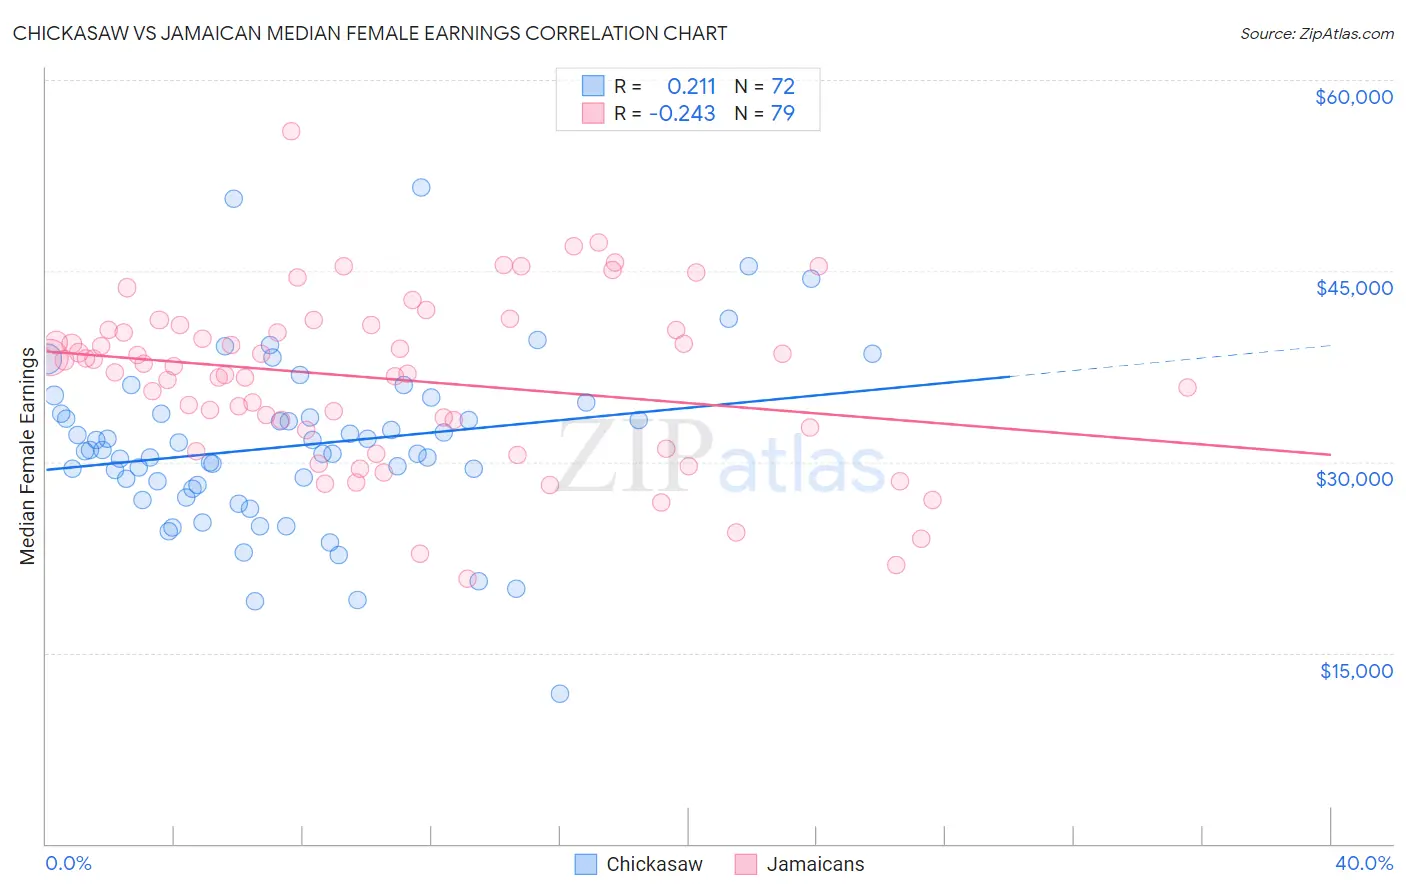
Chickasaw vs Jamaican Median Female Earnings Correlation Chart
The statistical analysis conducted on geographies consisting of 147,680,530 people shows a weak positive correlation between the proportion of Chickasaw and median female earnings in the United States with a correlation coefficient (R) of 0.211 and weighted average of $34,414. Similarly, the statistical analysis conducted on geographies consisting of 367,929,945 people shows a weak negative correlation between the proportion of Jamaicans and median female earnings in the United States with a correlation coefficient (R) of -0.243 and weighted average of $38,670, a difference of 12.4%.
Median Female Earnings Correlation Summary
| Measurement | Chickasaw | Jamaican |
| Minimum | $11,797 | $20,833 |
| Maximum | $51,543 | $56,012 |
| Range | $39,746 | $35,179 |
| Mean | $31,266 | $36,507 |
| Median | $30,877 | $37,552 |
| Interquartile 25% (IQ1) | $28,026 | $32,539 |
| Interquartile 75% (IQ3) | $33,779 | $40,387 |
| Interquartile Range (IQR) | $5,753 | $7,848 |
| Standard Deviation (Sample) | $6,735 | $6,597 |
| Standard Deviation (Population) | $6,688 | $6,555 |
Similar Demographics by Median Female Earnings
Demographics Similar to Chickasaw by Median Female Earnings
In terms of median female earnings, the demographic groups most similar to Chickasaw are Hispanic or Latino ($34,421, a difference of 0.020%), Seminole ($34,385, a difference of 0.080%), Immigrants from Congo ($34,317, a difference of 0.28%), Immigrants from Honduras ($34,647, a difference of 0.68%), and Shoshone ($34,677, a difference of 0.76%).
| Demographics | Rating | Rank | Median Female Earnings |
| Pennsylvania Germans | 0.0 /100 | #315 | Tragic $34,802 |
| Cherokee | 0.0 /100 | #316 | Tragic $34,742 |
| Potawatomi | 0.0 /100 | #317 | Tragic $34,739 |
| Immigrants | Yemen | 0.0 /100 | #318 | Tragic $34,693 |
| Shoshone | 0.0 /100 | #319 | Tragic $34,677 |
| Immigrants | Honduras | 0.0 /100 | #320 | Tragic $34,647 |
| Hispanics or Latinos | 0.0 /100 | #321 | Tragic $34,421 |
| Chickasaw | 0.0 /100 | #322 | Tragic $34,414 |
| Seminole | 0.0 /100 | #323 | Tragic $34,385 |
| Immigrants | Congo | 0.0 /100 | #324 | Tragic $34,317 |
| Dutch West Indians | 0.0 /100 | #325 | Tragic $34,106 |
| Kiowa | 0.0 /100 | #326 | Tragic $34,074 |
| Cajuns | 0.0 /100 | #327 | Tragic $34,034 |
| Immigrants | Central America | 0.0 /100 | #328 | Tragic $33,953 |
| Hopi | 0.0 /100 | #329 | Tragic $33,932 |
Demographics Similar to Jamaicans by Median Female Earnings
In terms of median female earnings, the demographic groups most similar to Jamaicans are Iraqi ($38,666, a difference of 0.010%), Spaniard ($38,656, a difference of 0.030%), Immigrants from Ecuador ($38,644, a difference of 0.070%), Guamanian/Chamorro ($38,717, a difference of 0.12%), and Immigrants from Jamaica ($38,625, a difference of 0.12%).
| Demographics | Rating | Rank | Median Female Earnings |
| Immigrants | Bosnia and Herzegovina | 15.6 /100 | #206 | Poor $38,886 |
| Immigrants | Cambodia | 14.2 /100 | #207 | Poor $38,833 |
| Immigrants | Thailand | 13.6 /100 | #208 | Poor $38,810 |
| Norwegians | 13.4 /100 | #209 | Poor $38,802 |
| Czechoslovakians | 12.0 /100 | #210 | Poor $38,738 |
| Aleuts | 11.6 /100 | #211 | Poor $38,719 |
| Guamanians/Chamorros | 11.5 /100 | #212 | Poor $38,717 |
| Jamaicans | 10.5 /100 | #213 | Poor $38,670 |
| Iraqis | 10.5 /100 | #214 | Poor $38,666 |
| Spaniards | 10.3 /100 | #215 | Poor $38,656 |
| Immigrants | Ecuador | 10.1 /100 | #216 | Poor $38,644 |
| Immigrants | Jamaica | 9.7 /100 | #217 | Tragic $38,625 |
| Cape Verdeans | 9.5 /100 | #218 | Tragic $38,614 |
| Nepalese | 9.3 /100 | #219 | Tragic $38,603 |
| Yugoslavians | 8.8 /100 | #220 | Tragic $38,573 |