Houma vs Immigrants from Brazil 8th Grade
COMPARE
Houma
Immigrants from Brazil
8th Grade
8th Grade Comparison
Houma
Immigrants from Brazil
94.2%
8TH GRADE
0.0/ 100
METRIC RATING
294th/ 347
METRIC RANK
95.7%
8TH GRADE
45.4/ 100
METRIC RATING
179th/ 347
METRIC RANK
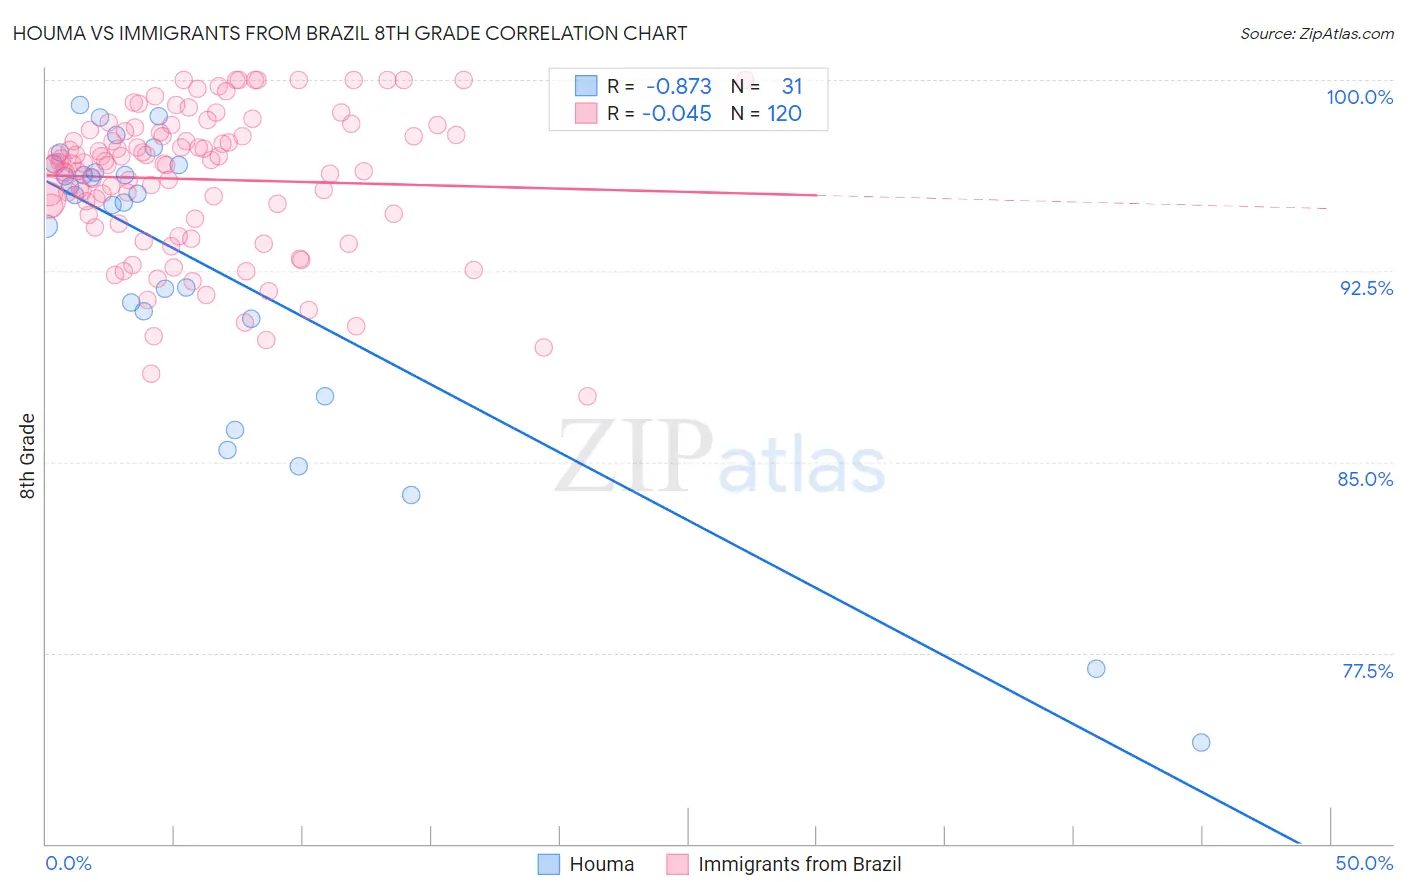
Houma vs Immigrants from Brazil 8th Grade Correlation Chart
The statistical analysis conducted on geographies consisting of 36,795,916 people shows a very strong negative correlation between the proportion of Houma and percentage of population with at least 8th grade education in the United States with a correlation coefficient (R) of -0.873 and weighted average of 94.2%. Similarly, the statistical analysis conducted on geographies consisting of 343,018,979 people shows no correlation between the proportion of Immigrants from Brazil and percentage of population with at least 8th grade education in the United States with a correlation coefficient (R) of -0.045 and weighted average of 95.7%, a difference of 1.6%.
8th Grade Correlation Summary
| Measurement | Houma | Immigrants from Brazil |
| Minimum | 74.0% | 87.6% |
| Maximum | 99.0% | 100.0% |
| Range | 25.0% | 12.4% |
| Mean | 92.6% | 96.1% |
| Median | 95.5% | 96.7% |
| Interquartile 25% (IQ1) | 90.6% | 94.6% |
| Interquartile 75% (IQ3) | 96.7% | 98.0% |
| Interquartile Range (IQR) | 6.0% | 3.3% |
| Standard Deviation (Sample) | 6.3% | 2.8% |
| Standard Deviation (Population) | 6.2% | 2.8% |
Similar Demographics by 8th Grade
Demographics Similar to Houma by 8th Grade
In terms of 8th grade, the demographic groups most similar to Houma are Yaqui (94.2%, a difference of 0.0%), Fijian (94.2%, a difference of 0.010%), Bangladeshi (94.3%, a difference of 0.030%), Haitian (94.2%, a difference of 0.030%), and Immigrants from South Eastern Asia (94.2%, a difference of 0.040%).
| Demographics | Rating | Rank | 8th Grade |
| Tohono O'odham | 0.0 /100 | #287 | Tragic 94.5% |
| Malaysians | 0.0 /100 | #288 | Tragic 94.5% |
| British West Indians | 0.0 /100 | #289 | Tragic 94.4% |
| Immigrants | West Indies | 0.0 /100 | #290 | Tragic 94.3% |
| Immigrants | Grenada | 0.0 /100 | #291 | Tragic 94.3% |
| Bangladeshis | 0.0 /100 | #292 | Tragic 94.3% |
| Yaqui | 0.0 /100 | #293 | Tragic 94.2% |
| Houma | 0.0 /100 | #294 | Tragic 94.2% |
| Fijians | 0.0 /100 | #295 | Tragic 94.2% |
| Haitians | 0.0 /100 | #296 | Tragic 94.2% |
| Immigrants | South Eastern Asia | 0.0 /100 | #297 | Tragic 94.2% |
| Indonesians | 0.0 /100 | #298 | Tragic 94.1% |
| Cubans | 0.0 /100 | #299 | Tragic 94.1% |
| Immigrants | Burma/Myanmar | 0.0 /100 | #300 | Tragic 94.1% |
| Immigrants | Laos | 0.0 /100 | #301 | Tragic 94.1% |
Demographics Similar to Immigrants from Brazil by 8th Grade
In terms of 8th grade, the demographic groups most similar to Immigrants from Brazil are Marshallese (95.7%, a difference of 0.010%), Venezuelan (95.7%, a difference of 0.010%), Pakistani (95.7%, a difference of 0.020%), Chilean (95.7%, a difference of 0.030%), and Immigrants from Albania (95.7%, a difference of 0.030%).
| Demographics | Rating | Rank | 8th Grade |
| Immigrants | Korea | 57.9 /100 | #172 | Average 95.8% |
| Mongolians | 53.0 /100 | #173 | Average 95.8% |
| Chileans | 50.0 /100 | #174 | Average 95.7% |
| Immigrants | Albania | 49.6 /100 | #175 | Average 95.7% |
| Pakistanis | 48.8 /100 | #176 | Average 95.7% |
| Marshallese | 47.6 /100 | #177 | Average 95.7% |
| Venezuelans | 47.5 /100 | #178 | Average 95.7% |
| Immigrants | Brazil | 45.4 /100 | #179 | Average 95.7% |
| Iraqis | 40.5 /100 | #180 | Average 95.7% |
| Immigrants | Spain | 38.7 /100 | #181 | Fair 95.7% |
| Immigrants | Egypt | 37.9 /100 | #182 | Fair 95.7% |
| Immigrants | Iraq | 36.2 /100 | #183 | Fair 95.6% |
| Immigrants | Uganda | 36.0 /100 | #184 | Fair 95.6% |
| Blacks/African Americans | 34.8 /100 | #185 | Fair 95.6% |
| Brazilians | 34.8 /100 | #186 | Fair 95.6% |