Houma vs Immigrants from Brazil In Labor Force | Age 20-24
COMPARE
Houma
Immigrants from Brazil
In Labor Force | Age 20-24
In Labor Force | Age 20-24 Comparison
Houma
Immigrants from Brazil
73.7%
IN LABOR FORCE | AGE 20-24
0.6/ 100
METRIC RATING
261st/ 347
METRIC RANK
75.5%
IN LABOR FORCE | AGE 20-24
84.8/ 100
METRIC RATING
136th/ 347
METRIC RANK
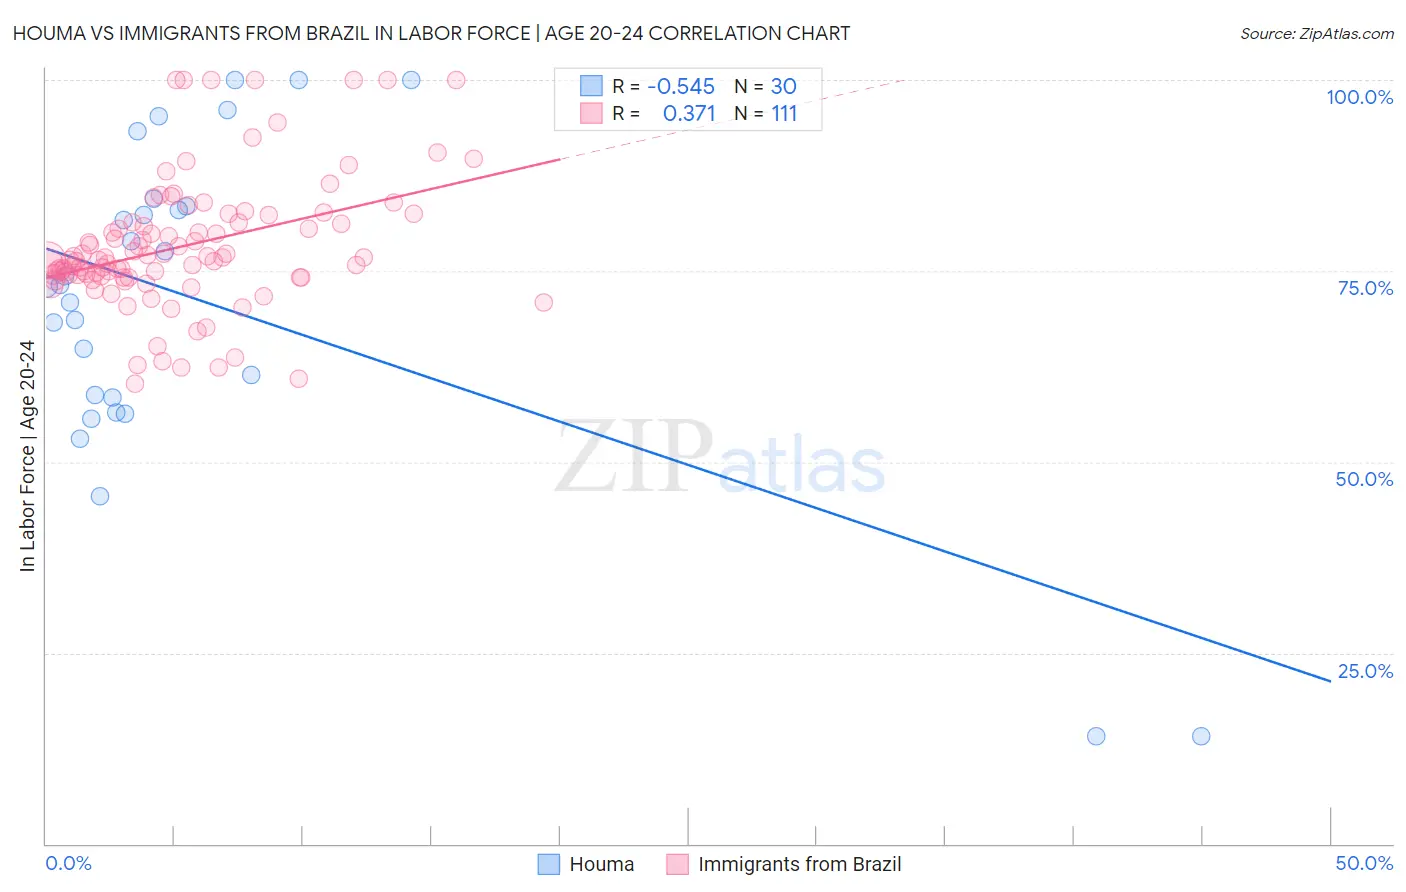
Houma vs Immigrants from Brazil In Labor Force | Age 20-24 Correlation Chart
The statistical analysis conducted on geographies consisting of 36,797,175 people shows a substantial negative correlation between the proportion of Houma and labor force participation rate among population between the ages 20 and 24 in the United States with a correlation coefficient (R) of -0.545 and weighted average of 73.7%. Similarly, the statistical analysis conducted on geographies consisting of 342,949,141 people shows a mild positive correlation between the proportion of Immigrants from Brazil and labor force participation rate among population between the ages 20 and 24 in the United States with a correlation coefficient (R) of 0.371 and weighted average of 75.5%, a difference of 2.5%.
In Labor Force | Age 20-24 Correlation Summary
| Measurement | Houma | Immigrants from Brazil |
| Minimum | 14.1% | 60.3% |
| Maximum | 100.0% | 100.0% |
| Range | 85.9% | 39.7% |
| Mean | 70.7% | 78.2% |
| Median | 73.1% | 76.4% |
| Interquartile 25% (IQ1) | 58.4% | 74.2% |
| Interquartile 75% (IQ3) | 83.5% | 81.3% |
| Interquartile Range (IQR) | 25.1% | 7.1% |
| Standard Deviation (Sample) | 21.7% | 8.5% |
| Standard Deviation (Population) | 21.3% | 8.5% |
Similar Demographics by In Labor Force | Age 20-24
Demographics Similar to Houma by In Labor Force | Age 20-24
In terms of in labor force | age 20-24, the demographic groups most similar to Houma are Immigrants from Turkey (73.7%, a difference of 0.010%), Asian (73.7%, a difference of 0.010%), Egyptian (73.7%, a difference of 0.040%), Dutch West Indian (73.7%, a difference of 0.040%), and Paraguayan (73.7%, a difference of 0.080%).
| Demographics | Rating | Rank | In Labor Force | Age 20-24 |
| Ute | 1.0 /100 | #254 | Tragic 73.8% |
| Immigrants | Pakistan | 0.9 /100 | #255 | Tragic 73.8% |
| Spanish American Indians | 0.8 /100 | #256 | Tragic 73.7% |
| Paraguayans | 0.8 /100 | #257 | Tragic 73.7% |
| Egyptians | 0.7 /100 | #258 | Tragic 73.7% |
| Dutch West Indians | 0.7 /100 | #259 | Tragic 73.7% |
| Immigrants | Turkey | 0.7 /100 | #260 | Tragic 73.7% |
| Houma | 0.6 /100 | #261 | Tragic 73.7% |
| Asians | 0.6 /100 | #262 | Tragic 73.7% |
| Immigrants | Asia | 0.5 /100 | #263 | Tragic 73.6% |
| Immigrants | Haiti | 0.5 /100 | #264 | Tragic 73.6% |
| Burmese | 0.5 /100 | #265 | Tragic 73.6% |
| Haitians | 0.5 /100 | #266 | Tragic 73.6% |
| Immigrants | Western Asia | 0.4 /100 | #267 | Tragic 73.5% |
| South Americans | 0.4 /100 | #268 | Tragic 73.5% |
Demographics Similar to Immigrants from Brazil by In Labor Force | Age 20-24
In terms of in labor force | age 20-24, the demographic groups most similar to Immigrants from Brazil are Jordanian (75.5%, a difference of 0.0%), Australian (75.5%, a difference of 0.0%), Immigrants from England (75.5%, a difference of 0.010%), Delaware (75.5%, a difference of 0.010%), and Yaqui (75.5%, a difference of 0.020%).
| Demographics | Rating | Rank | In Labor Force | Age 20-24 |
| Iroquois | 89.1 /100 | #129 | Excellent 75.6% |
| Immigrants | Austria | 88.8 /100 | #130 | Excellent 75.6% |
| Immigrants | Jordan | 88.5 /100 | #131 | Excellent 75.6% |
| Palestinians | 88.4 /100 | #132 | Excellent 75.6% |
| Zimbabweans | 88.2 /100 | #133 | Excellent 75.6% |
| Estonians | 87.1 /100 | #134 | Excellent 75.6% |
| Yaqui | 85.5 /100 | #135 | Excellent 75.5% |
| Immigrants | Brazil | 84.8 /100 | #136 | Excellent 75.5% |
| Jordanians | 84.8 /100 | #137 | Excellent 75.5% |
| Australians | 84.8 /100 | #138 | Excellent 75.5% |
| Immigrants | England | 84.6 /100 | #139 | Excellent 75.5% |
| Delaware | 84.5 /100 | #140 | Excellent 75.5% |
| Romanians | 84.1 /100 | #141 | Excellent 75.5% |
| Blackfeet | 83.6 /100 | #142 | Excellent 75.5% |
| Spaniards | 82.0 /100 | #143 | Excellent 75.5% |