Hmong vs Immigrants from China Householder Income Ages 25 - 44 years
COMPARE
Hmong
Immigrants from China
Householder Income Ages 25 - 44 years
Householder Income Ages 25 - 44 years Comparison
Hmong
Immigrants from China
$84,258
HOUSEHOLDER INCOME AGES 25 - 44 YEARS
0.3/ 100
METRIC RATING
267th/ 347
METRIC RANK
$119,756
HOUSEHOLDER INCOME AGES 25 - 44 YEARS
100.0/ 100
METRIC RATING
9th/ 347
METRIC RANK
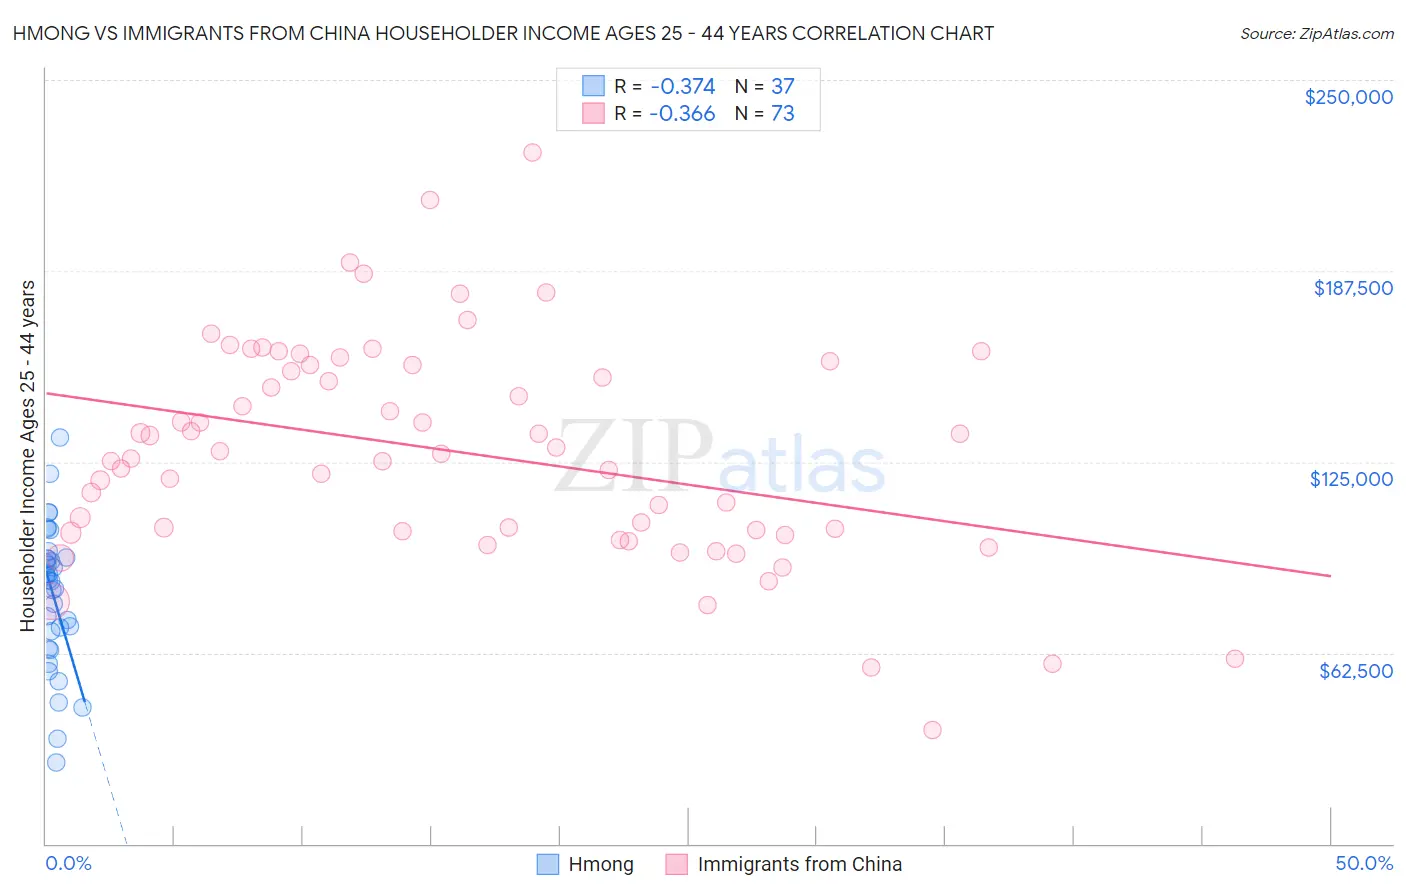
Hmong vs Immigrants from China Householder Income Ages 25 - 44 years Correlation Chart
The statistical analysis conducted on geographies consisting of 24,651,789 people shows a mild negative correlation between the proportion of Hmong and household income with householder between the ages 25 and 44 in the United States with a correlation coefficient (R) of -0.374 and weighted average of $84,258. Similarly, the statistical analysis conducted on geographies consisting of 455,414,350 people shows a mild negative correlation between the proportion of Immigrants from China and household income with householder between the ages 25 and 44 in the United States with a correlation coefficient (R) of -0.366 and weighted average of $119,756, a difference of 42.1%.
Householder Income Ages 25 - 44 years Correlation Summary
| Measurement | Hmong | Immigrants from China |
| Minimum | $26,488 | $37,292 |
| Maximum | $133,083 | $226,084 |
| Range | $106,595 | $188,792 |
| Mean | $81,379 | $128,177 |
| Median | $86,301 | $127,614 |
| Interquartile 25% (IQ1) | $66,711 | $101,947 |
| Interquartile 75% (IQ3) | $93,560 | $156,639 |
| Interquartile Range (IQR) | $26,850 | $54,692 |
| Standard Deviation (Sample) | $23,085 | $35,872 |
| Standard Deviation (Population) | $22,771 | $35,626 |
Similar Demographics by Householder Income Ages 25 - 44 years
Demographics Similar to Hmong by Householder Income Ages 25 - 44 years
In terms of householder income ages 25 - 44 years, the demographic groups most similar to Hmong are Subsaharan African ($84,235, a difference of 0.030%), Immigrants from Cabo Verde ($84,304, a difference of 0.050%), Sudanese ($84,401, a difference of 0.17%), Spanish American Indian ($84,085, a difference of 0.21%), and Osage ($84,461, a difference of 0.24%).
| Demographics | Rating | Rank | Householder Income Ages 25 - 44 years |
| Americans | 0.4 /100 | #260 | Tragic $84,791 |
| Inupiat | 0.4 /100 | #261 | Tragic $84,619 |
| Cree | 0.4 /100 | #262 | Tragic $84,574 |
| Belizeans | 0.4 /100 | #263 | Tragic $84,534 |
| Osage | 0.4 /100 | #264 | Tragic $84,461 |
| Sudanese | 0.4 /100 | #265 | Tragic $84,401 |
| Immigrants | Cabo Verde | 0.3 /100 | #266 | Tragic $84,304 |
| Hmong | 0.3 /100 | #267 | Tragic $84,258 |
| Sub-Saharan Africans | 0.3 /100 | #268 | Tragic $84,235 |
| Spanish American Indians | 0.3 /100 | #269 | Tragic $84,085 |
| Jamaicans | 0.3 /100 | #270 | Tragic $83,933 |
| Somalis | 0.2 /100 | #271 | Tragic $83,752 |
| Spanish Americans | 0.2 /100 | #272 | Tragic $83,722 |
| Iroquois | 0.2 /100 | #273 | Tragic $83,682 |
| Marshallese | 0.2 /100 | #274 | Tragic $83,575 |
Demographics Similar to Immigrants from China by Householder Income Ages 25 - 44 years
In terms of householder income ages 25 - 44 years, the demographic groups most similar to Immigrants from China are Indian (Asian) ($119,496, a difference of 0.22%), Okinawan ($119,349, a difference of 0.34%), Iranian ($120,292, a difference of 0.45%), Immigrants from Iran ($119,204, a difference of 0.46%), and Immigrants from Ireland ($120,333, a difference of 0.48%).
| Demographics | Rating | Rank | Householder Income Ages 25 - 44 years |
| Filipinos | 100.0 /100 | #2 | Exceptional $128,723 |
| Immigrants | Hong Kong | 100.0 /100 | #3 | Exceptional $128,140 |
| Immigrants | Singapore | 100.0 /100 | #4 | Exceptional $124,429 |
| Immigrants | India | 100.0 /100 | #5 | Exceptional $124,238 |
| Thais | 100.0 /100 | #6 | Exceptional $121,778 |
| Immigrants | Ireland | 100.0 /100 | #7 | Exceptional $120,333 |
| Iranians | 100.0 /100 | #8 | Exceptional $120,292 |
| Immigrants | China | 100.0 /100 | #9 | Exceptional $119,756 |
| Indians (Asian) | 100.0 /100 | #10 | Exceptional $119,496 |
| Okinawans | 100.0 /100 | #11 | Exceptional $119,349 |
| Immigrants | Iran | 100.0 /100 | #12 | Exceptional $119,204 |
| Immigrants | Eastern Asia | 100.0 /100 | #13 | Exceptional $118,056 |
| Immigrants | Israel | 100.0 /100 | #14 | Exceptional $117,219 |
| Immigrants | South Central Asia | 100.0 /100 | #15 | Exceptional $116,626 |
| Cypriots | 100.0 /100 | #16 | Exceptional $116,364 |