Hmong vs Immigrants from China 11th Grade
COMPARE
Hmong
Immigrants from China
11th Grade
11th Grade Comparison
Hmong
Immigrants from China
92.8%
11TH GRADE
78.6/ 100
METRIC RATING
148th/ 347
METRIC RANK
92.3%
11TH GRADE
25.1/ 100
METRIC RATING
201st/ 347
METRIC RANK
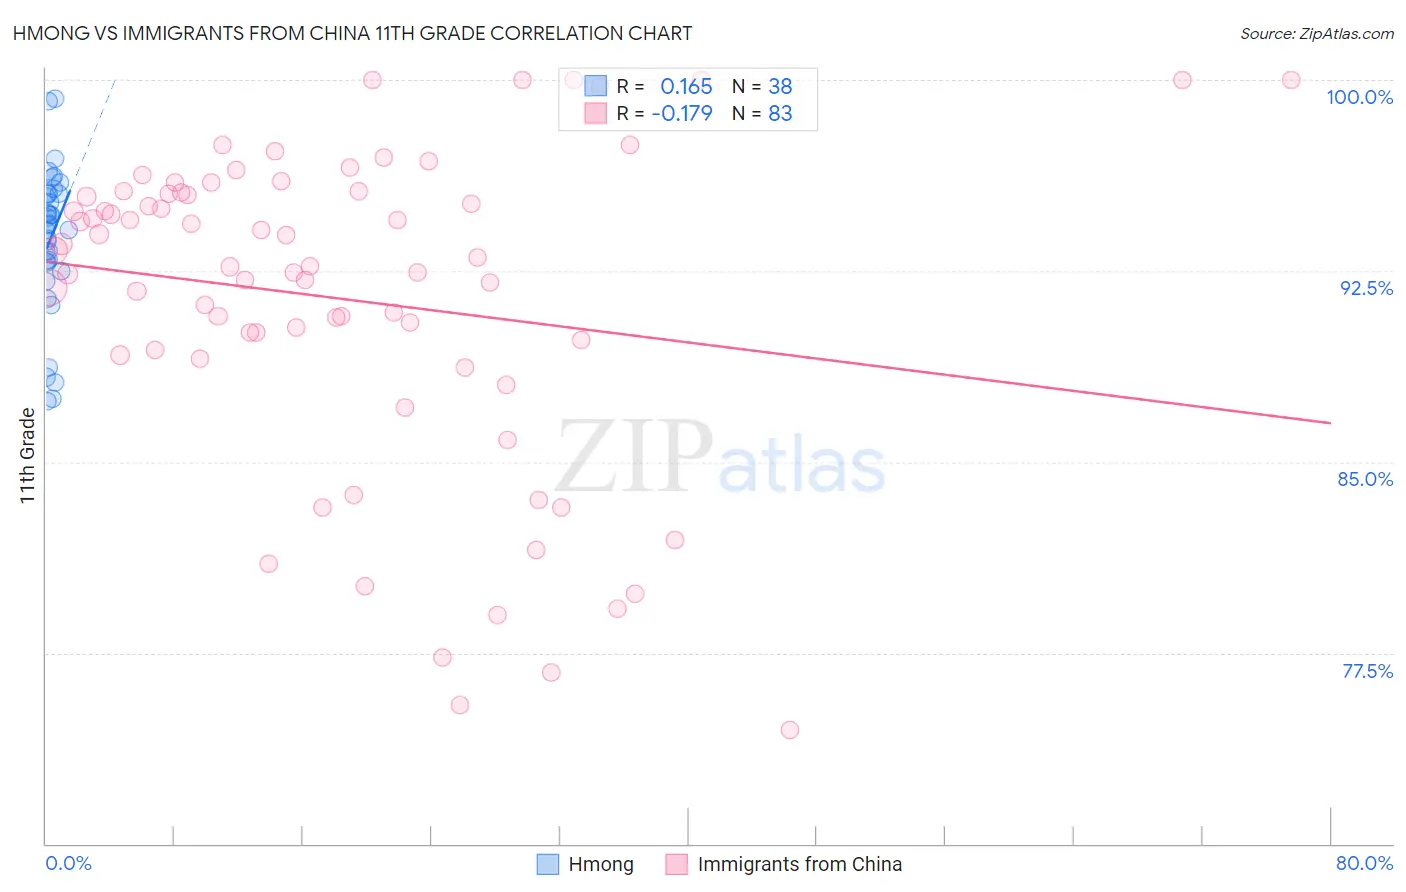
Hmong vs Immigrants from China 11th Grade Correlation Chart
The statistical analysis conducted on geographies consisting of 24,672,093 people shows a poor positive correlation between the proportion of Hmong and percentage of population with at least 11th grade education in the United States with a correlation coefficient (R) of 0.165 and weighted average of 92.8%. Similarly, the statistical analysis conducted on geographies consisting of 457,082,957 people shows a poor negative correlation between the proportion of Immigrants from China and percentage of population with at least 11th grade education in the United States with a correlation coefficient (R) of -0.179 and weighted average of 92.3%, a difference of 0.59%.
11th Grade Correlation Summary
| Measurement | Hmong | Immigrants from China |
| Minimum | 87.4% | 74.5% |
| Maximum | 99.2% | 100.0% |
| Range | 11.9% | 25.5% |
| Mean | 93.8% | 91.4% |
| Median | 94.3% | 92.7% |
| Interquartile 25% (IQ1) | 92.8% | 89.2% |
| Interquartile 75% (IQ3) | 95.5% | 95.6% |
| Interquartile Range (IQR) | 2.7% | 6.4% |
| Standard Deviation (Sample) | 2.9% | 6.3% |
| Standard Deviation (Population) | 2.8% | 6.3% |
Similar Demographics by 11th Grade
Demographics Similar to Hmong by 11th Grade
In terms of 11th grade, the demographic groups most similar to Hmong are Immigrants from Kenya (92.8%, a difference of 0.0%), Immigrants from Poland (92.8%, a difference of 0.0%), Iroquois (92.8%, a difference of 0.010%), Pakistani (92.8%, a difference of 0.020%), and Immigrants from Egypt (92.8%, a difference of 0.020%).
| Demographics | Rating | Rank | 11th Grade |
| Chileans | 83.0 /100 | #141 | Excellent 92.9% |
| Kenyans | 82.0 /100 | #142 | Excellent 92.9% |
| Ugandans | 81.4 /100 | #143 | Excellent 92.9% |
| Assyrians/Chaldeans/Syriacs | 80.5 /100 | #144 | Excellent 92.8% |
| Pakistanis | 79.6 /100 | #145 | Good 92.8% |
| Iroquois | 79.1 /100 | #146 | Good 92.8% |
| Immigrants | Kenya | 78.7 /100 | #147 | Good 92.8% |
| Hmong | 78.6 /100 | #148 | Good 92.8% |
| Immigrants | Poland | 78.5 /100 | #149 | Good 92.8% |
| Immigrants | Egypt | 77.5 /100 | #150 | Good 92.8% |
| Potawatomi | 74.3 /100 | #151 | Good 92.8% |
| Iraqis | 74.2 /100 | #152 | Good 92.8% |
| Brazilians | 73.9 /100 | #153 | Good 92.8% |
| Osage | 73.4 /100 | #154 | Good 92.7% |
| Argentineans | 73.4 /100 | #155 | Good 92.7% |
Demographics Similar to Immigrants from China by 11th Grade
In terms of 11th grade, the demographic groups most similar to Immigrants from China are Immigrants from Uganda (92.3%, a difference of 0.0%), Samoan (92.3%, a difference of 0.0%), Marshallese (92.3%, a difference of 0.010%), Hawaiian (92.3%, a difference of 0.010%), and Immigrants from Eastern Africa (92.3%, a difference of 0.010%).
| Demographics | Rating | Rank | 11th Grade |
| Sioux | 28.5 /100 | #194 | Fair 92.3% |
| Liberians | 26.8 /100 | #195 | Fair 92.3% |
| Panamanians | 26.4 /100 | #196 | Fair 92.3% |
| Marshallese | 26.0 /100 | #197 | Fair 92.3% |
| Hawaiians | 25.5 /100 | #198 | Fair 92.3% |
| Immigrants | Uganda | 25.2 /100 | #199 | Fair 92.3% |
| Samoans | 25.1 /100 | #200 | Fair 92.3% |
| Immigrants | China | 25.1 /100 | #201 | Fair 92.3% |
| Immigrants | Eastern Africa | 24.1 /100 | #202 | Fair 92.3% |
| Immigrants | Sudan | 23.5 /100 | #203 | Fair 92.3% |
| Immigrants | Hong Kong | 23.3 /100 | #204 | Fair 92.2% |
| Kiowa | 23.2 /100 | #205 | Fair 92.2% |
| Bolivians | 23.2 /100 | #206 | Fair 92.2% |
| Immigrants | Oceania | 22.4 /100 | #207 | Fair 92.2% |
| Colville | 21.8 /100 | #208 | Fair 92.2% |