Guamanian/Chamorro vs Polish In Labor Force | Age 30-34
COMPARE
Guamanian/Chamorro
Polish
In Labor Force | Age 30-34
In Labor Force | Age 30-34 Comparison
Guamanians/Chamorros
Poles
83.5%
IN LABOR FORCE | AGE 30-34
0.0/ 100
METRIC RATING
273rd/ 347
METRIC RANK
85.5%
IN LABOR FORCE | AGE 30-34
99.6/ 100
METRIC RATING
58th/ 347
METRIC RANK
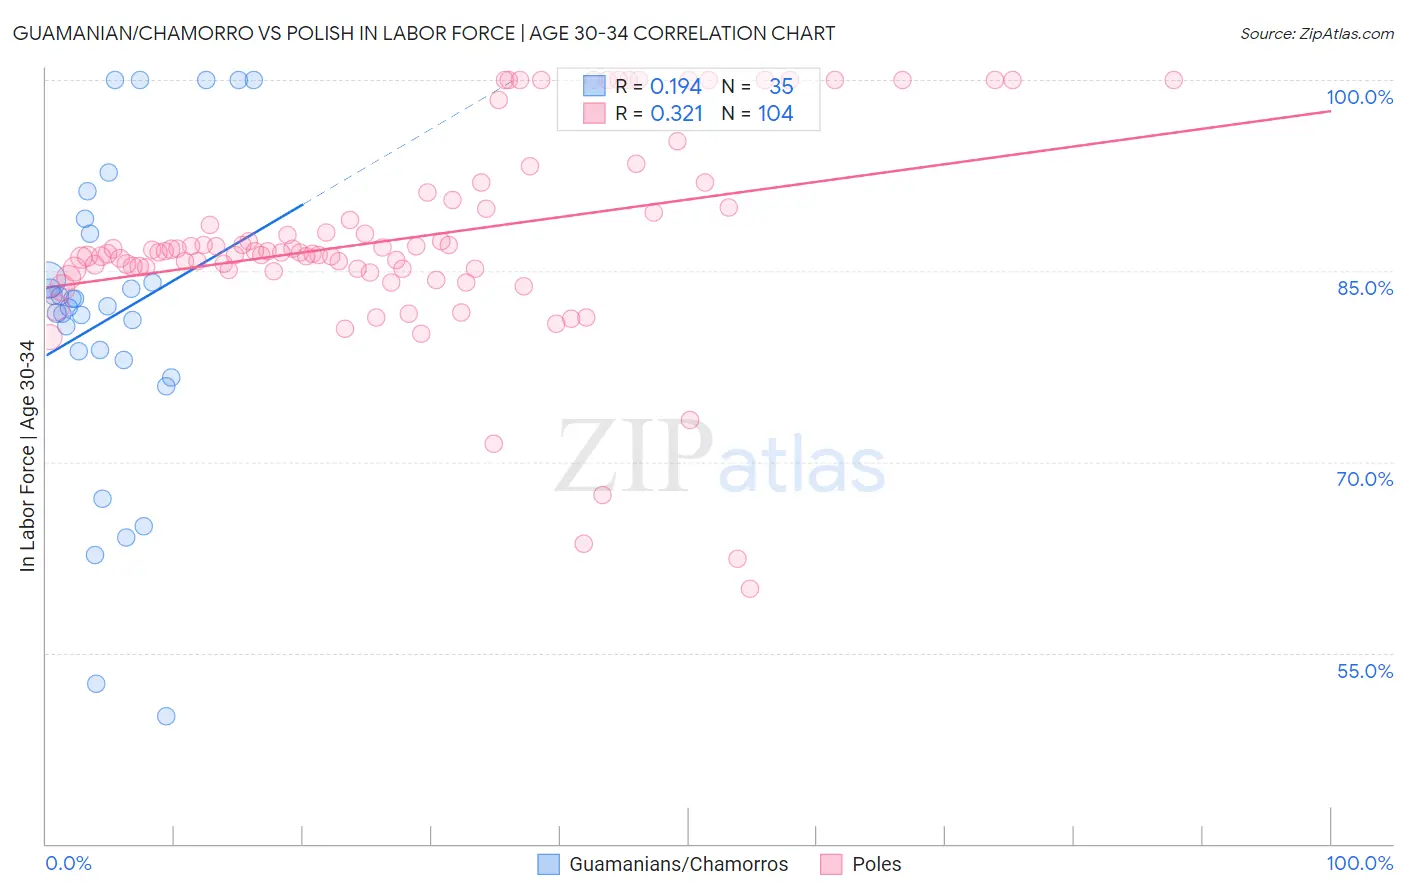
Guamanian/Chamorro vs Polish In Labor Force | Age 30-34 Correlation Chart
The statistical analysis conducted on geographies consisting of 221,913,161 people shows a poor positive correlation between the proportion of Guamanians/Chamorros and labor force participation rate among population between the ages 30 and 34 in the United States with a correlation coefficient (R) of 0.194 and weighted average of 83.5%. Similarly, the statistical analysis conducted on geographies consisting of 559,395,237 people shows a mild positive correlation between the proportion of Poles and labor force participation rate among population between the ages 30 and 34 in the United States with a correlation coefficient (R) of 0.321 and weighted average of 85.5%, a difference of 2.4%.
In Labor Force | Age 30-34 Correlation Summary
| Measurement | Guamanian/Chamorro | Polish |
| Minimum | 50.0% | 60.0% |
| Maximum | 100.0% | 100.0% |
| Range | 50.0% | 40.0% |
| Mean | 81.4% | 87.5% |
| Median | 82.3% | 86.5% |
| Interquartile 25% (IQ1) | 78.0% | 85.2% |
| Interquartile 75% (IQ3) | 87.9% | 90.3% |
| Interquartile Range (IQR) | 9.9% | 5.1% |
| Standard Deviation (Sample) | 12.3% | 8.0% |
| Standard Deviation (Population) | 12.1% | 7.9% |
Similar Demographics by In Labor Force | Age 30-34
Demographics Similar to Guamanians/Chamorros by In Labor Force | Age 30-34
In terms of in labor force | age 30-34, the demographic groups most similar to Guamanians/Chamorros are Belizean (83.5%, a difference of 0.010%), Immigrants from Grenada (83.5%, a difference of 0.020%), Tongan (83.5%, a difference of 0.020%), Delaware (83.5%, a difference of 0.040%), and Spanish (83.5%, a difference of 0.050%).
| Demographics | Rating | Rank | In Labor Force | Age 30-34 |
| Immigrants | Guatemala | 0.1 /100 | #266 | Tragic 83.7% |
| Spaniards | 0.1 /100 | #267 | Tragic 83.6% |
| Immigrants | Bangladesh | 0.1 /100 | #268 | Tragic 83.6% |
| Vietnamese | 0.1 /100 | #269 | Tragic 83.6% |
| Spanish Americans | 0.0 /100 | #270 | Tragic 83.5% |
| Spanish | 0.0 /100 | #271 | Tragic 83.5% |
| Immigrants | Nonimmigrants | 0.0 /100 | #272 | Tragic 83.5% |
| Guamanians/Chamorros | 0.0 /100 | #273 | Tragic 83.5% |
| Belizeans | 0.0 /100 | #274 | Tragic 83.5% |
| Immigrants | Grenada | 0.0 /100 | #275 | Tragic 83.5% |
| Tongans | 0.0 /100 | #276 | Tragic 83.5% |
| Delaware | 0.0 /100 | #277 | Tragic 83.5% |
| Fijians | 0.0 /100 | #278 | Tragic 83.4% |
| Immigrants | Fiji | 0.0 /100 | #279 | Tragic 83.4% |
| Africans | 0.0 /100 | #280 | Tragic 83.4% |
Demographics Similar to Poles by In Labor Force | Age 30-34
In terms of in labor force | age 30-34, the demographic groups most similar to Poles are Russian (85.5%, a difference of 0.0%), Immigrants from Turkey (85.5%, a difference of 0.010%), Czech (85.5%, a difference of 0.010%), Immigrants from Poland (85.5%, a difference of 0.010%), and Immigrants from Kenya (85.5%, a difference of 0.020%).
| Demographics | Rating | Rank | In Labor Force | Age 30-34 |
| Cape Verdeans | 99.7 /100 | #51 | Exceptional 85.6% |
| Slovenes | 99.7 /100 | #52 | Exceptional 85.6% |
| Filipinos | 99.6 /100 | #53 | Exceptional 85.5% |
| Immigrants | Kenya | 99.6 /100 | #54 | Exceptional 85.5% |
| Immigrants | Turkey | 99.6 /100 | #55 | Exceptional 85.5% |
| Czechs | 99.6 /100 | #56 | Exceptional 85.5% |
| Russians | 99.6 /100 | #57 | Exceptional 85.5% |
| Poles | 99.6 /100 | #58 | Exceptional 85.5% |
| Immigrants | Poland | 99.5 /100 | #59 | Exceptional 85.5% |
| Immigrants | France | 99.5 /100 | #60 | Exceptional 85.5% |
| Immigrants | Brazil | 99.5 /100 | #61 | Exceptional 85.5% |
| Soviet Union | 99.4 /100 | #62 | Exceptional 85.5% |
| Macedonians | 99.4 /100 | #63 | Exceptional 85.5% |
| Italians | 99.4 /100 | #64 | Exceptional 85.4% |
| Senegalese | 99.4 /100 | #65 | Exceptional 85.4% |