Celtic vs Panamanian Householder Income Over 65 years
COMPARE
Celtic
Panamanian
Householder Income Over 65 years
Householder Income Over 65 years Comparison
Celtics
Panamanians
$60,608
HOUSEHOLDER INCOME OVER 65 YEARS
40.7/ 100
METRIC RATING
181st/ 347
METRIC RANK
$58,266
HOUSEHOLDER INCOME OVER 65 YEARS
5.6/ 100
METRIC RATING
218th/ 347
METRIC RANK
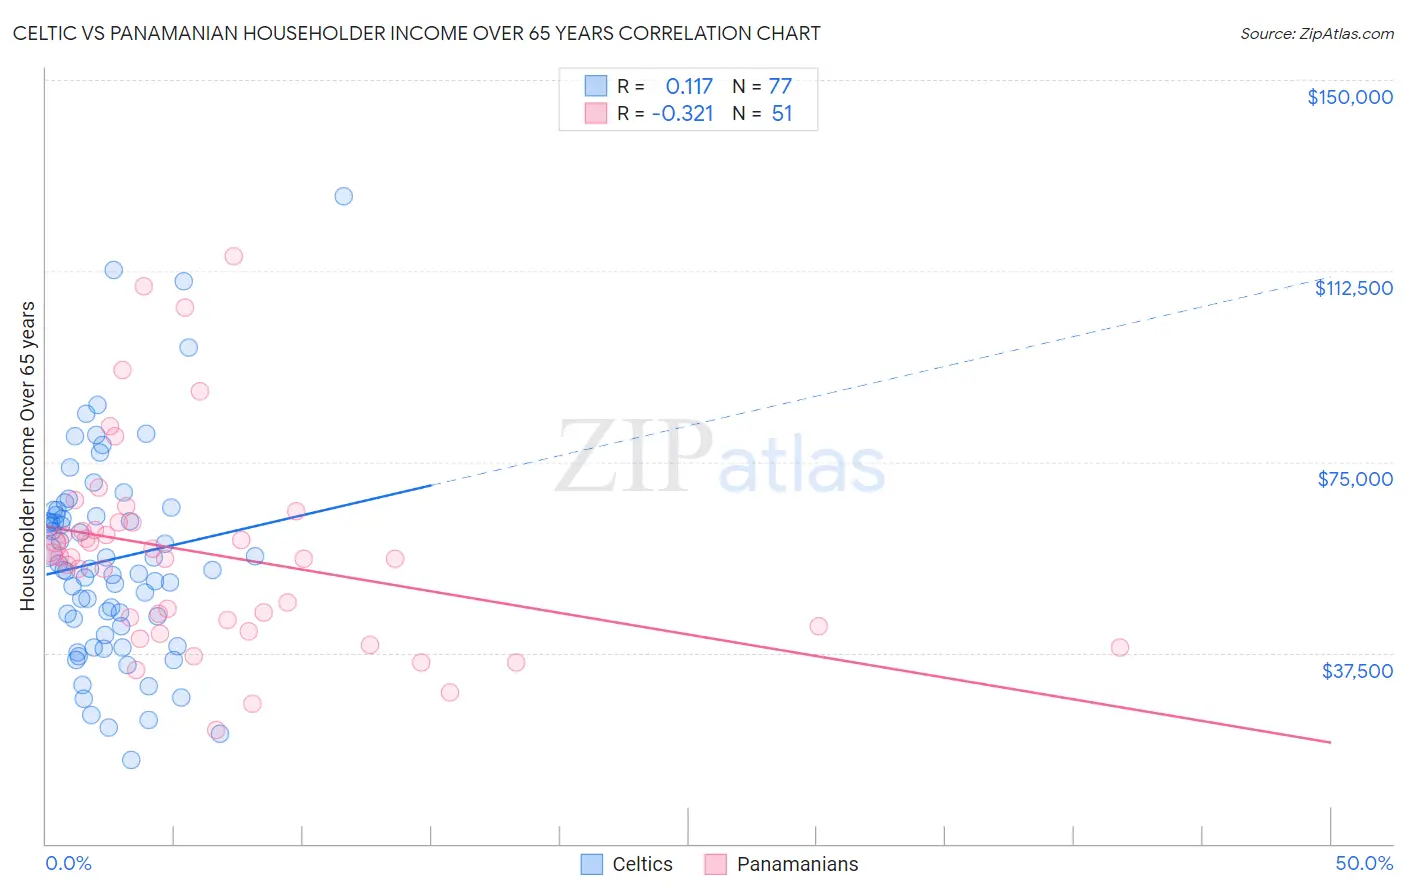
Celtic vs Panamanian Householder Income Over 65 years Correlation Chart
The statistical analysis conducted on geographies consisting of 168,665,390 people shows a poor positive correlation between the proportion of Celtics and household income with householder over the age of 65 in the United States with a correlation coefficient (R) of 0.117 and weighted average of $60,608. Similarly, the statistical analysis conducted on geographies consisting of 280,268,554 people shows a mild negative correlation between the proportion of Panamanians and household income with householder over the age of 65 in the United States with a correlation coefficient (R) of -0.321 and weighted average of $58,266, a difference of 4.0%.
Householder Income Over 65 years Correlation Summary
| Measurement | Celtic | Panamanian |
| Minimum | $16,365 | $22,448 |
| Maximum | $127,250 | $115,417 |
| Range | $110,885 | $92,969 |
| Mean | $55,793 | $56,997 |
| Median | $53,750 | $56,289 |
| Interquartile 25% (IQ1) | $41,861 | $42,656 |
| Interquartile 75% (IQ3) | $65,041 | $63,024 |
| Interquartile Range (IQR) | $23,179 | $20,368 |
| Standard Deviation (Sample) | $20,641 | $19,848 |
| Standard Deviation (Population) | $20,507 | $19,652 |
Similar Demographics by Householder Income Over 65 years
Demographics Similar to Celtics by Householder Income Over 65 years
In terms of householder income over 65 years, the demographic groups most similar to Celtics are Czechoslovakian ($60,581, a difference of 0.040%), Immigrants from Morocco ($60,647, a difference of 0.060%), Welsh ($60,666, a difference of 0.10%), Kenyan ($60,514, a difference of 0.15%), and Yup'ik ($60,727, a difference of 0.20%).
| Demographics | Rating | Rank | Householder Income Over 65 years |
| Luxembourgers | 50.0 /100 | #174 | Average $60,967 |
| Spaniards | 47.3 /100 | #175 | Average $60,866 |
| Spanish | 45.5 /100 | #176 | Average $60,795 |
| Alaska Natives | 44.3 /100 | #177 | Average $60,748 |
| Yup'ik | 43.7 /100 | #178 | Average $60,727 |
| Welsh | 42.2 /100 | #179 | Average $60,666 |
| Immigrants | Morocco | 41.7 /100 | #180 | Average $60,647 |
| Celtics | 40.7 /100 | #181 | Average $60,608 |
| Czechoslovakians | 40.0 /100 | #182 | Average $60,581 |
| Kenyans | 38.4 /100 | #183 | Fair $60,514 |
| Iraqis | 37.2 /100 | #184 | Fair $60,466 |
| Albanians | 32.0 /100 | #185 | Fair $60,249 |
| Slovenes | 31.8 /100 | #186 | Fair $60,241 |
| Immigrants | Thailand | 31.3 /100 | #187 | Fair $60,217 |
| Immigrants | Eritrea | 28.6 /100 | #188 | Fair $60,096 |
Demographics Similar to Panamanians by Householder Income Over 65 years
In terms of householder income over 65 years, the demographic groups most similar to Panamanians are Sudanese ($58,281, a difference of 0.030%), Malaysian ($58,244, a difference of 0.040%), Yugoslavian ($58,243, a difference of 0.040%), Immigrants from El Salvador ($58,226, a difference of 0.070%), and Delaware ($58,214, a difference of 0.090%).
| Demographics | Rating | Rank | Householder Income Over 65 years |
| Immigrants | Nigeria | 10.7 /100 | #211 | Poor $58,942 |
| Colombians | 9.8 /100 | #212 | Tragic $58,851 |
| Whites/Caucasians | 9.8 /100 | #213 | Tragic $58,847 |
| Nepalese | 9.0 /100 | #214 | Tragic $58,761 |
| Immigrants | Ghana | 7.9 /100 | #215 | Tragic $58,624 |
| Immigrants | Middle Africa | 6.2 /100 | #216 | Tragic $58,375 |
| Sudanese | 5.7 /100 | #217 | Tragic $58,281 |
| Panamanians | 5.6 /100 | #218 | Tragic $58,266 |
| Malaysians | 5.5 /100 | #219 | Tragic $58,244 |
| Yugoslavians | 5.5 /100 | #220 | Tragic $58,243 |
| Immigrants | El Salvador | 5.4 /100 | #221 | Tragic $58,226 |
| Delaware | 5.3 /100 | #222 | Tragic $58,214 |
| Tsimshian | 5.2 /100 | #223 | Tragic $58,202 |
| Bermudans | 5.1 /100 | #224 | Tragic $58,171 |
| Venezuelans | 4.4 /100 | #225 | Tragic $58,026 |