Guamanian/Chamorro vs Hawaiian Householder Income Under 25 years
COMPARE
Guamanian/Chamorro
Hawaiian
Householder Income Under 25 years
Householder Income Under 25 years Comparison
Guamanians/Chamorros
Hawaiians
$53,423
HOUSEHOLDER INCOME UNDER 25 YEARS
95.3/ 100
METRIC RATING
120th/ 347
METRIC RANK
$53,078
HOUSEHOLDER INCOME UNDER 25 YEARS
89.8/ 100
METRIC RATING
140th/ 347
METRIC RANK
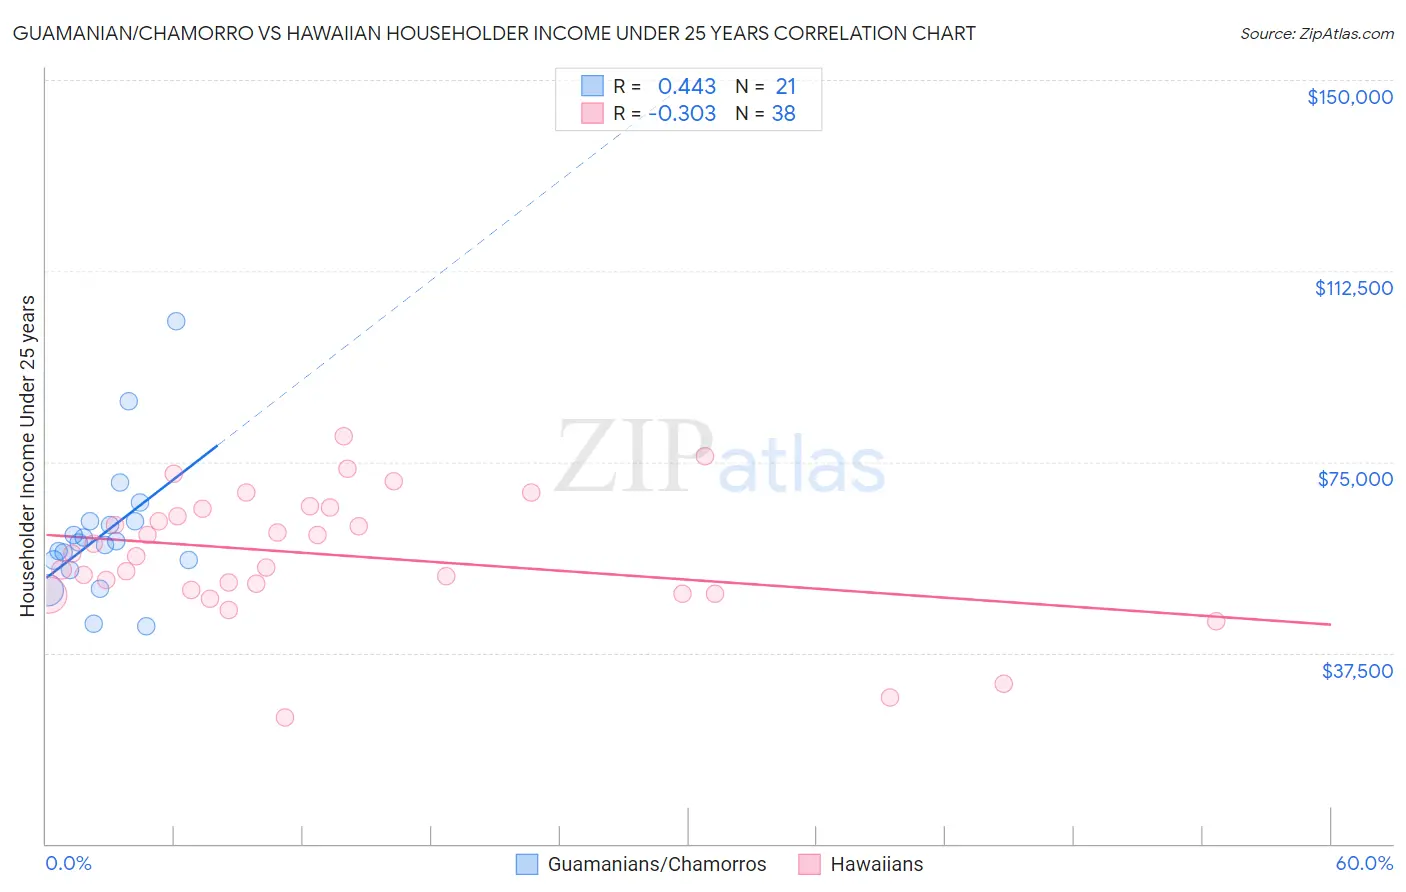
Guamanian/Chamorro vs Hawaiian Householder Income Under 25 years Correlation Chart
The statistical analysis conducted on geographies consisting of 200,760,858 people shows a moderate positive correlation between the proportion of Guamanians/Chamorros and household income with householder under the age of 25 in the United States with a correlation coefficient (R) of 0.443 and weighted average of $53,423. Similarly, the statistical analysis conducted on geographies consisting of 288,171,696 people shows a mild negative correlation between the proportion of Hawaiians and household income with householder under the age of 25 in the United States with a correlation coefficient (R) of -0.303 and weighted average of $53,078, a difference of 0.65%.
Householder Income Under 25 years Correlation Summary
| Measurement | Guamanian/Chamorro | Hawaiian |
| Minimum | $42,829 | $24,709 |
| Maximum | $102,571 | $80,098 |
| Range | $59,742 | $55,389 |
| Mean | $60,959 | $56,783 |
| Median | $59,082 | $56,779 |
| Interquartile 25% (IQ1) | $54,739 | $49,786 |
| Interquartile 75% (IQ3) | $63,324 | $65,721 |
| Interquartile Range (IQR) | $8,585 | $15,935 |
| Standard Deviation (Sample) | $13,387 | $12,327 |
| Standard Deviation (Population) | $13,064 | $12,164 |
Demographics Similar to Guamanians/Chamorros and Hawaiians by Householder Income Under 25 years
In terms of householder income under 25 years, the demographic groups most similar to Guamanians/Chamorros are Immigrants from Canada ($53,411, a difference of 0.020%), Immigrants from Ethiopia ($53,408, a difference of 0.030%), Immigrants from Iraq ($53,384, a difference of 0.070%), Colombian ($53,357, a difference of 0.12%), and Pakistani ($53,325, a difference of 0.18%). Similarly, the demographic groups most similar to Hawaiians are Costa Rican ($53,106, a difference of 0.050%), Norwegian ($53,127, a difference of 0.090%), Immigrants from Barbados ($53,163, a difference of 0.16%), Armenian ($53,179, a difference of 0.19%), and Immigrants from Northern Africa ($53,185, a difference of 0.20%).
| Demographics | Rating | Rank | Householder Income Under 25 years |
| Guamanians/Chamorros | 95.3 /100 | #120 | Exceptional $53,423 |
| Immigrants | Canada | 95.2 /100 | #121 | Exceptional $53,411 |
| Immigrants | Ethiopia | 95.2 /100 | #122 | Exceptional $53,408 |
| Immigrants | Iraq | 94.9 /100 | #123 | Exceptional $53,384 |
| Colombians | 94.6 /100 | #124 | Exceptional $53,357 |
| Pakistanis | 94.1 /100 | #125 | Exceptional $53,325 |
| Immigrants | Serbia | 94.1 /100 | #126 | Exceptional $53,321 |
| Immigrants | North America | 93.9 /100 | #127 | Exceptional $53,307 |
| Immigrants | Bulgaria | 93.9 /100 | #128 | Exceptional $53,305 |
| New Zealanders | 93.7 /100 | #129 | Exceptional $53,294 |
| Nicaraguans | 93.4 /100 | #130 | Exceptional $53,275 |
| Immigrants | Nicaragua | 93.3 /100 | #131 | Exceptional $53,266 |
| Moroccans | 93.1 /100 | #132 | Exceptional $53,256 |
| Immigrants | Immigrants | 92.2 /100 | #133 | Exceptional $53,201 |
| Immigrants | Northern Africa | 91.9 /100 | #134 | Exceptional $53,185 |
| Chileans | 91.9 /100 | #135 | Exceptional $53,185 |
| Armenians | 91.8 /100 | #136 | Exceptional $53,179 |
| Immigrants | Barbados | 91.5 /100 | #137 | Exceptional $53,163 |
| Norwegians | 90.8 /100 | #138 | Exceptional $53,127 |
| Costa Ricans | 90.4 /100 | #139 | Exceptional $53,106 |
| Hawaiians | 89.8 /100 | #140 | Excellent $53,078 |