Immigrants from Korea vs Cajun Householder Income Over 65 years
COMPARE
Immigrants from Korea
Cajun
Householder Income Over 65 years
Householder Income Over 65 years Comparison
Immigrants from Korea
Cajuns
$70,696
HOUSEHOLDER INCOME OVER 65 YEARS
100.0/ 100
METRIC RATING
17th/ 347
METRIC RANK
$51,397
HOUSEHOLDER INCOME OVER 65 YEARS
0.0/ 100
METRIC RATING
323rd/ 347
METRIC RANK
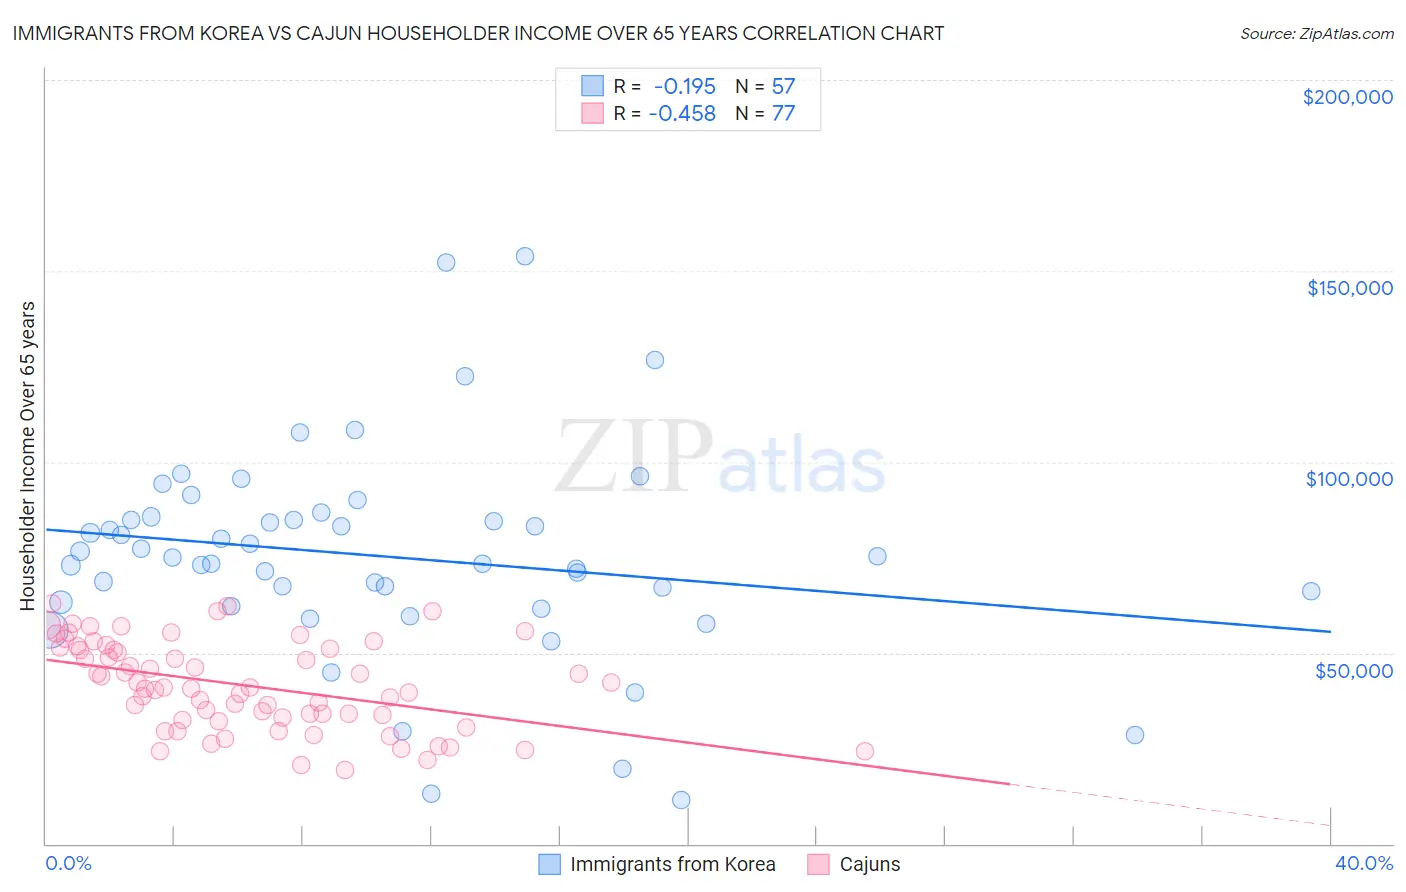
Immigrants from Korea vs Cajun Householder Income Over 65 years Correlation Chart
The statistical analysis conducted on geographies consisting of 414,435,632 people shows a poor negative correlation between the proportion of Immigrants from Korea and household income with householder over the age of 65 in the United States with a correlation coefficient (R) of -0.195 and weighted average of $70,696. Similarly, the statistical analysis conducted on geographies consisting of 149,395,361 people shows a moderate negative correlation between the proportion of Cajuns and household income with householder over the age of 65 in the United States with a correlation coefficient (R) of -0.458 and weighted average of $51,397, a difference of 37.6%.
Householder Income Over 65 years Correlation Summary
| Measurement | Immigrants from Korea | Cajun |
| Minimum | $11,563 | $19,375 |
| Maximum | $153,930 | $62,907 |
| Range | $142,367 | $43,532 |
| Mean | $75,285 | $41,476 |
| Median | $74,994 | $40,796 |
| Interquartile 25% (IQ1) | $62,762 | $32,741 |
| Interquartile 75% (IQ3) | $85,219 | $51,179 |
| Interquartile Range (IQR) | $22,457 | $18,438 |
| Standard Deviation (Sample) | $27,458 | $11,437 |
| Standard Deviation (Population) | $27,216 | $11,362 |
Similar Demographics by Householder Income Over 65 years
Demographics Similar to Immigrants from Korea by Householder Income Over 65 years
In terms of householder income over 65 years, the demographic groups most similar to Immigrants from Korea are Okinawan ($70,846, a difference of 0.21%), Eastern European ($70,470, a difference of 0.32%), Native Hawaiian ($71,021, a difference of 0.46%), Burmese ($71,139, a difference of 0.63%), and Indian (Asian) ($70,238, a difference of 0.65%).
| Demographics | Rating | Rank | Householder Income Over 65 years |
| Bhutanese | 100.0 /100 | #10 | Exceptional $72,288 |
| Thais | 100.0 /100 | #11 | Exceptional $72,099 |
| Cypriots | 100.0 /100 | #12 | Exceptional $71,714 |
| Immigrants | Hong Kong | 100.0 /100 | #13 | Exceptional $71,567 |
| Burmese | 100.0 /100 | #14 | Exceptional $71,139 |
| Native Hawaiians | 100.0 /100 | #15 | Exceptional $71,021 |
| Okinawans | 100.0 /100 | #16 | Exceptional $70,846 |
| Immigrants | Korea | 100.0 /100 | #17 | Exceptional $70,696 |
| Eastern Europeans | 100.0 /100 | #18 | Exceptional $70,470 |
| Indians (Asian) | 100.0 /100 | #19 | Exceptional $70,238 |
| Immigrants | South Central Asia | 100.0 /100 | #20 | Exceptional $70,103 |
| Immigrants | Eastern Asia | 100.0 /100 | #21 | Exceptional $69,872 |
| Immigrants | Israel | 100.0 /100 | #22 | Exceptional $69,857 |
| Immigrants | Japan | 100.0 /100 | #23 | Exceptional $69,774 |
| Immigrants | Sweden | 100.0 /100 | #24 | Exceptional $69,722 |
Demographics Similar to Cajuns by Householder Income Over 65 years
In terms of householder income over 65 years, the demographic groups most similar to Cajuns are Immigrants from Congo ($51,393, a difference of 0.010%), British West Indian ($51,463, a difference of 0.13%), Immigrants from Haiti ($51,219, a difference of 0.35%), Kiowa ($51,140, a difference of 0.50%), and Menominee ($51,719, a difference of 0.63%).
| Demographics | Rating | Rank | Householder Income Over 65 years |
| Creek | 0.0 /100 | #316 | Tragic $51,949 |
| Immigrants | St. Vincent and the Grenadines | 0.0 /100 | #317 | Tragic $51,922 |
| Haitians | 0.0 /100 | #318 | Tragic $51,912 |
| Immigrants | Honduras | 0.0 /100 | #319 | Tragic $51,888 |
| Colville | 0.0 /100 | #320 | Tragic $51,739 |
| Menominee | 0.0 /100 | #321 | Tragic $51,719 |
| British West Indians | 0.0 /100 | #322 | Tragic $51,463 |
| Cajuns | 0.0 /100 | #323 | Tragic $51,397 |
| Immigrants | Congo | 0.0 /100 | #324 | Tragic $51,393 |
| Immigrants | Haiti | 0.0 /100 | #325 | Tragic $51,219 |
| Kiowa | 0.0 /100 | #326 | Tragic $51,140 |
| Bahamians | 0.0 /100 | #327 | Tragic $51,000 |
| Hopi | 0.0 /100 | #328 | Tragic $50,925 |
| Blacks/African Americans | 0.0 /100 | #329 | Tragic $50,779 |
| Immigrants | Grenada | 0.0 /100 | #330 | Tragic $50,747 |