European vs Tohono O'odham Wage/Income Gap
COMPARE
European
Tohono O'odham
Wage/Income Gap
Wage/Income Gap Comparison
Europeans
Tohono O'odham
29.4%
WAGE/INCOME GAP
0.0/ 100
METRIC RATING
333rd/ 347
METRIC RANK
22.1%
WAGE/INCOME GAP
100.0/ 100
METRIC RATING
51st/ 347
METRIC RANK
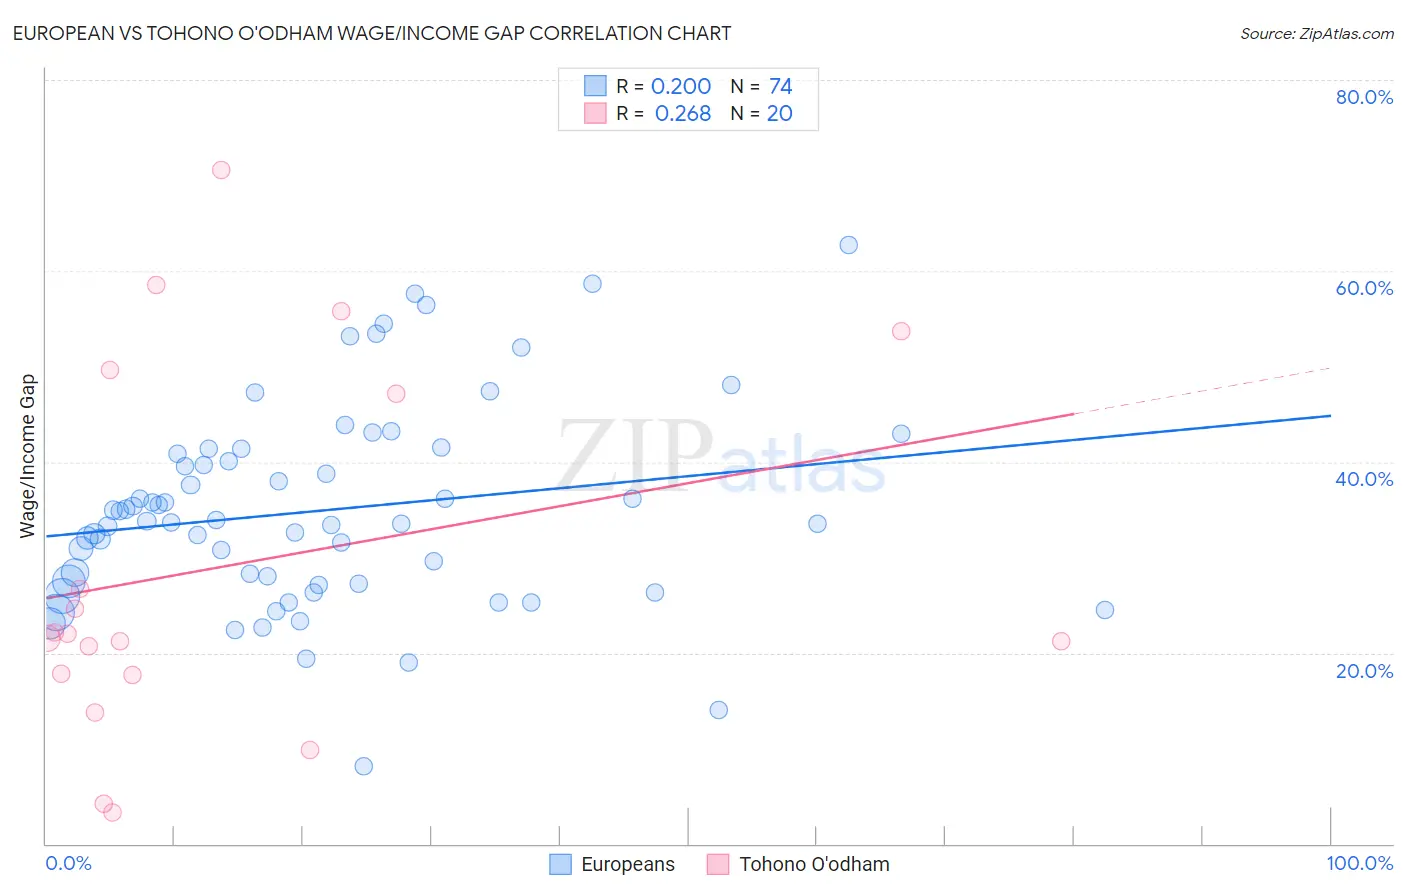
European vs Tohono O'odham Wage/Income Gap Correlation Chart
The statistical analysis conducted on geographies consisting of 559,619,805 people shows a weak positive correlation between the proportion of Europeans and wage/income gap percentage in the United States with a correlation coefficient (R) of 0.200 and weighted average of 29.4%. Similarly, the statistical analysis conducted on geographies consisting of 58,710,489 people shows a weak positive correlation between the proportion of Tohono O'odham and wage/income gap percentage in the United States with a correlation coefficient (R) of 0.268 and weighted average of 22.1%, a difference of 32.7%.
Wage/Income Gap Correlation Summary
| Measurement | European | Tohono O'odham |
| Minimum | 8.1% | 3.3% |
| Maximum | 62.8% | 70.6% |
| Range | 54.6% | 67.3% |
| Mean | 34.9% | 29.1% |
| Median | 33.8% | 21.8% |
| Interquartile 25% (IQ1) | 27.2% | 17.8% |
| Interquartile 75% (IQ3) | 40.8% | 48.4% |
| Interquartile Range (IQR) | 13.6% | 30.7% |
| Standard Deviation (Sample) | 10.6% | 19.4% |
| Standard Deviation (Population) | 10.5% | 19.0% |
Similar Demographics by Wage/Income Gap
Demographics Similar to Europeans by Wage/Income Gap
In terms of wage/income gap, the demographic groups most similar to Europeans are Swedish (29.4%, a difference of 0.14%), Immigrants from South Central Asia (29.3%, a difference of 0.19%), Immigrants from Taiwan (29.5%, a difference of 0.27%), English (29.5%, a difference of 0.28%), and Czech (29.2%, a difference of 0.70%).
| Demographics | Rating | Rank | Wage/Income Gap |
| Immigrants | Belgium | 0.0 /100 | #326 | Tragic 29.0% |
| Immigrants | Iran | 0.0 /100 | #327 | Tragic 29.1% |
| Scandinavians | 0.0 /100 | #328 | Tragic 29.1% |
| Scottish | 0.0 /100 | #329 | Tragic 29.1% |
| Germans | 0.0 /100 | #330 | Tragic 29.2% |
| Czechs | 0.0 /100 | #331 | Tragic 29.2% |
| Immigrants | South Central Asia | 0.0 /100 | #332 | Tragic 29.3% |
| Europeans | 0.0 /100 | #333 | Tragic 29.4% |
| Swedes | 0.0 /100 | #334 | Tragic 29.4% |
| Immigrants | Taiwan | 0.0 /100 | #335 | Tragic 29.5% |
| English | 0.0 /100 | #336 | Tragic 29.5% |
| Dutch | 0.0 /100 | #337 | Tragic 29.6% |
| Filipinos | 0.0 /100 | #338 | Tragic 29.7% |
| Iranians | 0.0 /100 | #339 | Tragic 29.7% |
| Swiss | 0.0 /100 | #340 | Tragic 30.0% |
Demographics Similar to Tohono O'odham by Wage/Income Gap
In terms of wage/income gap, the demographic groups most similar to Tohono O'odham are Immigrants from Cameroon (22.2%, a difference of 0.080%), Bangladeshi (22.2%, a difference of 0.10%), Nepalese (22.2%, a difference of 0.32%), Immigrants from Western Africa (22.0%, a difference of 0.44%), and Immigrants from Zaire (22.3%, a difference of 0.72%).
| Demographics | Rating | Rank | Wage/Income Gap |
| Immigrants | Eritrea | 100.0 /100 | #44 | Exceptional 21.4% |
| U.S. Virgin Islanders | 100.0 /100 | #45 | Exceptional 21.5% |
| Immigrants | Ethiopia | 100.0 /100 | #46 | Exceptional 21.6% |
| Immigrants | Congo | 100.0 /100 | #47 | Exceptional 21.7% |
| Blacks/African Americans | 100.0 /100 | #48 | Exceptional 21.7% |
| Ethiopians | 100.0 /100 | #49 | Exceptional 21.8% |
| Immigrants | Western Africa | 100.0 /100 | #50 | Exceptional 22.0% |
| Tohono O'odham | 100.0 /100 | #51 | Exceptional 22.1% |
| Immigrants | Cameroon | 100.0 /100 | #52 | Exceptional 22.2% |
| Bangladeshis | 100.0 /100 | #53 | Exceptional 22.2% |
| Nepalese | 100.0 /100 | #54 | Exceptional 22.2% |
| Immigrants | Zaire | 100.0 /100 | #55 | Exceptional 22.3% |
| Immigrants | Ghana | 100.0 /100 | #56 | Exceptional 22.3% |
| Ghanaians | 100.0 /100 | #57 | Exceptional 22.3% |
| Immigrants | Cuba | 100.0 /100 | #58 | Exceptional 22.4% |