European vs White/Caucasian Wage/Income Gap
COMPARE
European
White/Caucasian
Wage/Income Gap
Wage/Income Gap Comparison
Europeans
Whites/Caucasians
29.4%
WAGE/INCOME GAP
0.0/ 100
METRIC RATING
333rd/ 347
METRIC RANK
28.5%
WAGE/INCOME GAP
0.1/ 100
METRIC RATING
306th/ 347
METRIC RANK
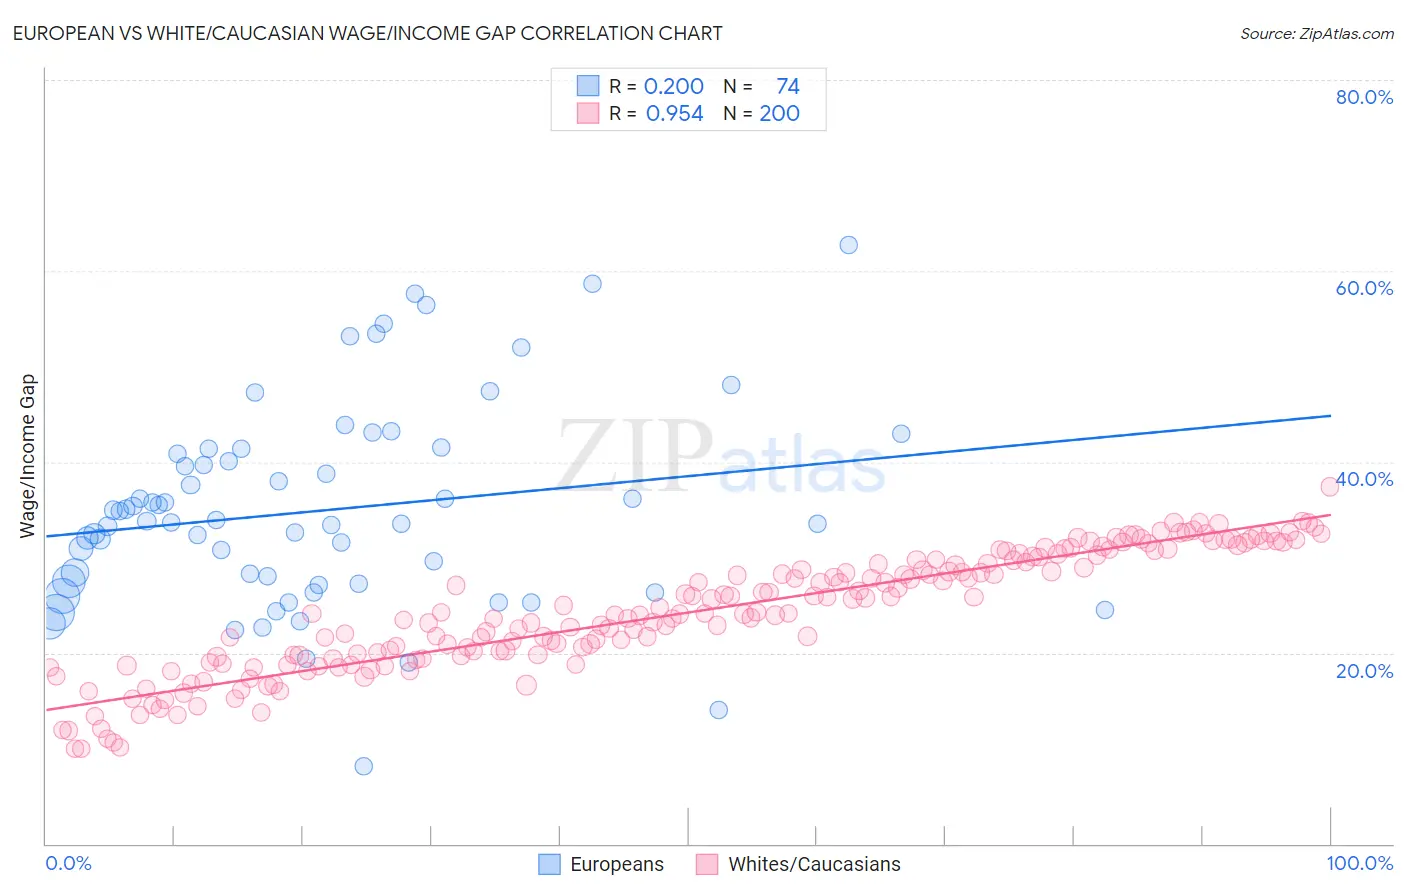
European vs White/Caucasian Wage/Income Gap Correlation Chart
The statistical analysis conducted on geographies consisting of 559,619,805 people shows a weak positive correlation between the proportion of Europeans and wage/income gap percentage in the United States with a correlation coefficient (R) of 0.200 and weighted average of 29.4%. Similarly, the statistical analysis conducted on geographies consisting of 580,089,064 people shows a perfect positive correlation between the proportion of Whites/Caucasians and wage/income gap percentage in the United States with a correlation coefficient (R) of 0.954 and weighted average of 28.5%, a difference of 3.0%.
Wage/Income Gap Correlation Summary
| Measurement | European | White/Caucasian |
| Minimum | 8.1% | 9.9% |
| Maximum | 62.8% | 37.4% |
| Range | 54.6% | 27.5% |
| Mean | 34.9% | 24.2% |
| Median | 33.8% | 24.1% |
| Interquartile 25% (IQ1) | 27.2% | 19.6% |
| Interquartile 75% (IQ3) | 40.8% | 29.7% |
| Interquartile Range (IQR) | 13.6% | 10.1% |
| Standard Deviation (Sample) | 10.6% | 6.2% |
| Standard Deviation (Population) | 10.5% | 6.2% |
Similar Demographics by Wage/Income Gap
Demographics Similar to Europeans by Wage/Income Gap
In terms of wage/income gap, the demographic groups most similar to Europeans are Swedish (29.4%, a difference of 0.14%), Immigrants from South Central Asia (29.3%, a difference of 0.19%), Immigrants from Taiwan (29.5%, a difference of 0.27%), English (29.5%, a difference of 0.28%), and Czech (29.2%, a difference of 0.70%).
| Demographics | Rating | Rank | Wage/Income Gap |
| Immigrants | Belgium | 0.0 /100 | #326 | Tragic 29.0% |
| Immigrants | Iran | 0.0 /100 | #327 | Tragic 29.1% |
| Scandinavians | 0.0 /100 | #328 | Tragic 29.1% |
| Scottish | 0.0 /100 | #329 | Tragic 29.1% |
| Germans | 0.0 /100 | #330 | Tragic 29.2% |
| Czechs | 0.0 /100 | #331 | Tragic 29.2% |
| Immigrants | South Central Asia | 0.0 /100 | #332 | Tragic 29.3% |
| Europeans | 0.0 /100 | #333 | Tragic 29.4% |
| Swedes | 0.0 /100 | #334 | Tragic 29.4% |
| Immigrants | Taiwan | 0.0 /100 | #335 | Tragic 29.5% |
| English | 0.0 /100 | #336 | Tragic 29.5% |
| Dutch | 0.0 /100 | #337 | Tragic 29.6% |
| Filipinos | 0.0 /100 | #338 | Tragic 29.7% |
| Iranians | 0.0 /100 | #339 | Tragic 29.7% |
| Swiss | 0.0 /100 | #340 | Tragic 30.0% |
Demographics Similar to Whites/Caucasians by Wage/Income Gap
In terms of wage/income gap, the demographic groups most similar to Whites/Caucasians are Immigrants from Denmark (28.5%, a difference of 0.010%), Immigrants from South Africa (28.5%, a difference of 0.050%), Immigrants from Netherlands (28.5%, a difference of 0.060%), Polish (28.5%, a difference of 0.080%), and Scotch-Irish (28.5%, a difference of 0.14%).
| Demographics | Rating | Rank | Wage/Income Gap |
| Immigrants | North Macedonia | 0.2 /100 | #299 | Tragic 28.4% |
| Immigrants | Northern Europe | 0.2 /100 | #300 | Tragic 28.5% |
| Immigrants | Canada | 0.2 /100 | #301 | Tragic 28.5% |
| Scotch-Irish | 0.2 /100 | #302 | Tragic 28.5% |
| Irish | 0.2 /100 | #303 | Tragic 28.5% |
| Immigrants | Netherlands | 0.2 /100 | #304 | Tragic 28.5% |
| Immigrants | South Africa | 0.1 /100 | #305 | Tragic 28.5% |
| Whites/Caucasians | 0.1 /100 | #306 | Tragic 28.5% |
| Immigrants | Denmark | 0.1 /100 | #307 | Tragic 28.5% |
| Poles | 0.1 /100 | #308 | Tragic 28.5% |
| Macedonians | 0.1 /100 | #309 | Tragic 28.6% |
| Finns | 0.1 /100 | #310 | Tragic 28.6% |
| Immigrants | Lithuania | 0.1 /100 | #311 | Tragic 28.6% |
| Eastern Europeans | 0.1 /100 | #312 | Tragic 28.6% |
| French | 0.1 /100 | #313 | Tragic 28.7% |