Dominican vs Cheyenne Median Earnings
COMPARE
Dominican
Cheyenne
Median Earnings
Median Earnings Comparison
Dominicans
Cheyenne
$41,864
MEDIAN EARNINGS
0.2/ 100
METRIC RATING
283rd/ 347
METRIC RANK
$40,233
MEDIAN EARNINGS
0.0/ 100
METRIC RATING
314th/ 347
METRIC RANK
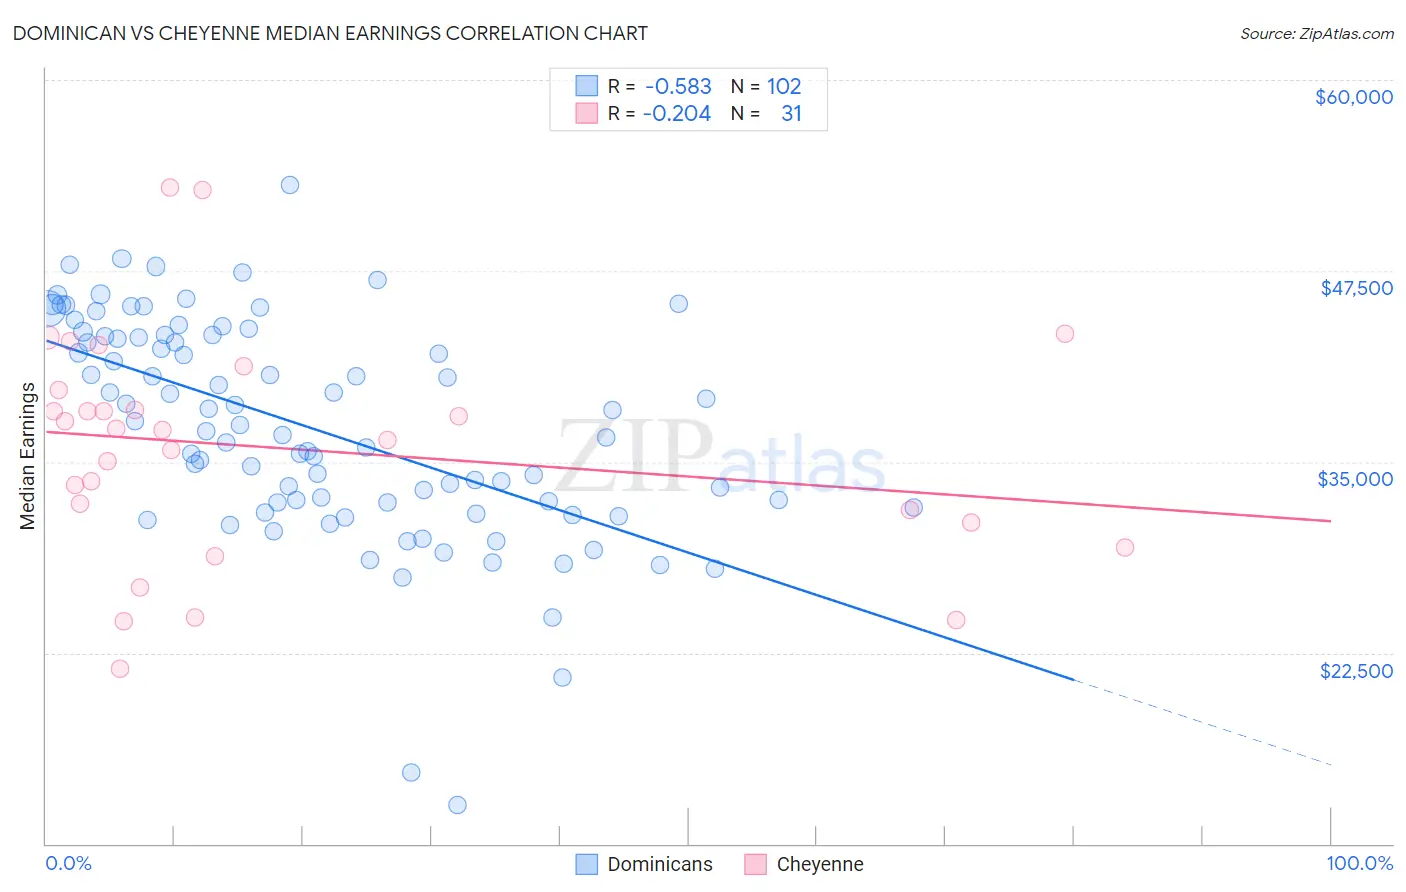
Dominican vs Cheyenne Median Earnings Correlation Chart
The statistical analysis conducted on geographies consisting of 355,132,428 people shows a substantial negative correlation between the proportion of Dominicans and median earnings in the United States with a correlation coefficient (R) of -0.583 and weighted average of $41,864. Similarly, the statistical analysis conducted on geographies consisting of 80,717,230 people shows a weak negative correlation between the proportion of Cheyenne and median earnings in the United States with a correlation coefficient (R) of -0.204 and weighted average of $40,233, a difference of 4.1%.
Median Earnings Correlation Summary
| Measurement | Dominican | Cheyenne |
| Minimum | $12,552 | $21,433 |
| Maximum | $53,134 | $52,964 |
| Range | $40,582 | $31,531 |
| Mean | $37,192 | $35,877 |
| Median | $37,213 | $37,115 |
| Interquartile 25% (IQ1) | $32,338 | $31,011 |
| Interquartile 75% (IQ3) | $43,235 | $39,717 |
| Interquartile Range (IQR) | $10,898 | $8,706 |
| Standard Deviation (Sample) | $7,182 | $7,496 |
| Standard Deviation (Population) | $7,146 | $7,374 |
Similar Demographics by Median Earnings
Demographics Similar to Dominicans by Median Earnings
In terms of median earnings, the demographic groups most similar to Dominicans are Blackfeet ($41,822, a difference of 0.10%), African ($41,955, a difference of 0.22%), Marshallese ($41,969, a difference of 0.25%), Immigrants from Nicaragua ($41,737, a difference of 0.31%), and Mexican American Indian ($41,719, a difference of 0.35%).
| Demographics | Rating | Rank | Median Earnings |
| Spanish Americans | 0.3 /100 | #276 | Tragic $42,316 |
| Central Americans | 0.3 /100 | #277 | Tragic $42,280 |
| Cajuns | 0.3 /100 | #278 | Tragic $42,189 |
| Colville | 0.2 /100 | #279 | Tragic $42,151 |
| Hmong | 0.2 /100 | #280 | Tragic $42,111 |
| Marshallese | 0.2 /100 | #281 | Tragic $41,969 |
| Africans | 0.2 /100 | #282 | Tragic $41,955 |
| Dominicans | 0.2 /100 | #283 | Tragic $41,864 |
| Blackfeet | 0.2 /100 | #284 | Tragic $41,822 |
| Immigrants | Nicaragua | 0.1 /100 | #285 | Tragic $41,737 |
| Mexican American Indians | 0.1 /100 | #286 | Tragic $41,719 |
| Indonesians | 0.1 /100 | #287 | Tragic $41,701 |
| Immigrants | Dominican Republic | 0.1 /100 | #288 | Tragic $41,554 |
| Comanche | 0.1 /100 | #289 | Tragic $41,519 |
| Paiute | 0.1 /100 | #290 | Tragic $41,508 |
Demographics Similar to Cheyenne by Median Earnings
In terms of median earnings, the demographic groups most similar to Cheyenne are Seminole ($40,233, a difference of 0.0%), Choctaw ($40,270, a difference of 0.090%), Immigrants from Honduras ($40,195, a difference of 0.10%), Fijian ($40,193, a difference of 0.10%), and Chippewa ($40,287, a difference of 0.13%).
| Demographics | Rating | Rank | Median Earnings |
| Hondurans | 0.0 /100 | #307 | Tragic $40,638 |
| Cubans | 0.0 /100 | #308 | Tragic $40,619 |
| Immigrants | Haiti | 0.0 /100 | #309 | Tragic $40,550 |
| Apache | 0.0 /100 | #310 | Tragic $40,388 |
| Hispanics or Latinos | 0.0 /100 | #311 | Tragic $40,288 |
| Chippewa | 0.0 /100 | #312 | Tragic $40,287 |
| Choctaw | 0.0 /100 | #313 | Tragic $40,270 |
| Cheyenne | 0.0 /100 | #314 | Tragic $40,233 |
| Seminole | 0.0 /100 | #315 | Tragic $40,233 |
| Immigrants | Honduras | 0.0 /100 | #316 | Tragic $40,195 |
| Fijians | 0.0 /100 | #317 | Tragic $40,193 |
| Dutch West Indians | 0.0 /100 | #318 | Tragic $40,107 |
| Blacks/African Americans | 0.0 /100 | #319 | Tragic $40,085 |
| Immigrants | Bahamas | 0.0 /100 | #320 | Tragic $39,861 |
| Mexicans | 0.0 /100 | #321 | Tragic $39,834 |