Irish vs Cheyenne Median Earnings
COMPARE
Irish
Cheyenne
Median Earnings
Median Earnings Comparison
Irish
Cheyenne
$47,276
MEDIAN EARNINGS
76.6/ 100
METRIC RATING
156th/ 347
METRIC RANK
$40,233
MEDIAN EARNINGS
0.0/ 100
METRIC RATING
314th/ 347
METRIC RANK
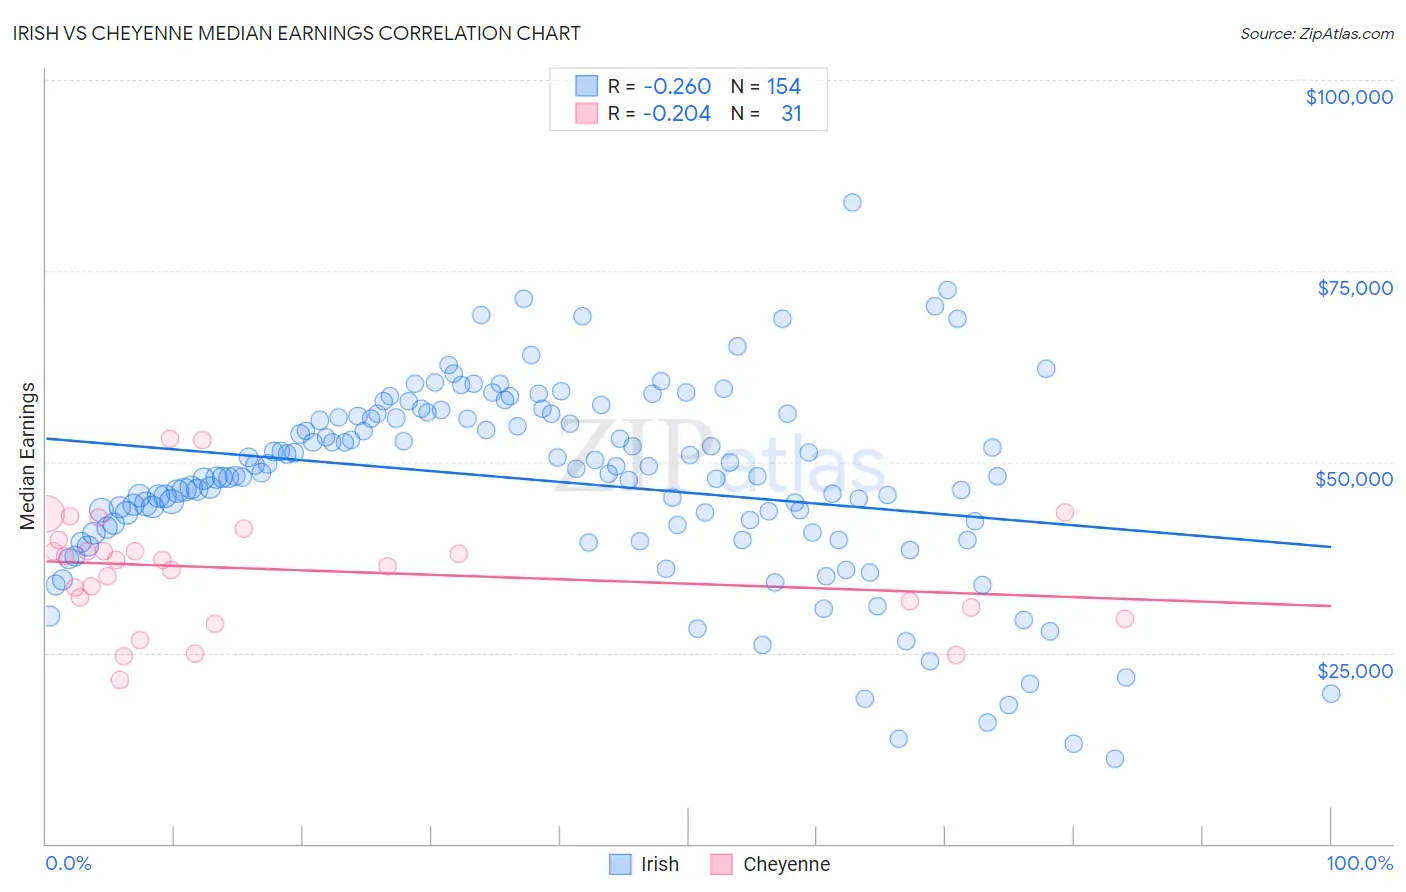
Irish vs Cheyenne Median Earnings Correlation Chart
The statistical analysis conducted on geographies consisting of 579,915,662 people shows a weak negative correlation between the proportion of Irish and median earnings in the United States with a correlation coefficient (R) of -0.260 and weighted average of $47,276. Similarly, the statistical analysis conducted on geographies consisting of 80,717,230 people shows a weak negative correlation between the proportion of Cheyenne and median earnings in the United States with a correlation coefficient (R) of -0.204 and weighted average of $40,233, a difference of 17.5%.
Median Earnings Correlation Summary
| Measurement | Irish | Cheyenne |
| Minimum | $11,055 | $21,433 |
| Maximum | $83,906 | $52,964 |
| Range | $72,851 | $31,531 |
| Mean | $47,509 | $35,877 |
| Median | $48,301 | $37,115 |
| Interquartile 25% (IQ1) | $41,366 | $31,011 |
| Interquartile 75% (IQ3) | $56,002 | $39,717 |
| Interquartile Range (IQR) | $14,636 | $8,706 |
| Standard Deviation (Sample) | $12,668 | $7,496 |
| Standard Deviation (Population) | $12,626 | $7,374 |
Similar Demographics by Median Earnings
Demographics Similar to Irish by Median Earnings
In terms of median earnings, the demographic groups most similar to Irish are Immigrants from Vietnam ($47,282, a difference of 0.010%), Immigrants from Portugal ($47,304, a difference of 0.060%), Czech ($47,221, a difference of 0.12%), Slovak ($47,095, a difference of 0.38%), and Slavic ($47,470, a difference of 0.41%).
| Demographics | Rating | Rank | Median Earnings |
| Luxembourgers | 84.5 /100 | #149 | Excellent $47,640 |
| Peruvians | 84.2 /100 | #150 | Excellent $47,628 |
| Immigrants | Oceania | 84.1 /100 | #151 | Excellent $47,617 |
| Immigrants | Germany | 83.1 /100 | #152 | Excellent $47,566 |
| Slavs | 81.1 /100 | #153 | Excellent $47,470 |
| Immigrants | Portugal | 77.3 /100 | #154 | Good $47,304 |
| Immigrants | Vietnam | 76.7 /100 | #155 | Good $47,282 |
| Irish | 76.6 /100 | #156 | Good $47,276 |
| Czechs | 75.1 /100 | #157 | Good $47,221 |
| Slovaks | 71.7 /100 | #158 | Good $47,095 |
| Immigrants | Peru | 69.6 /100 | #159 | Good $47,025 |
| Alsatians | 69.6 /100 | #160 | Good $47,023 |
| Immigrants | Eastern Africa | 68.0 /100 | #161 | Good $46,969 |
| South American Indians | 67.4 /100 | #162 | Good $46,952 |
| Icelanders | 66.3 /100 | #163 | Good $46,916 |
Demographics Similar to Cheyenne by Median Earnings
In terms of median earnings, the demographic groups most similar to Cheyenne are Seminole ($40,233, a difference of 0.0%), Choctaw ($40,270, a difference of 0.090%), Immigrants from Honduras ($40,195, a difference of 0.10%), Fijian ($40,193, a difference of 0.10%), and Chippewa ($40,287, a difference of 0.13%).
| Demographics | Rating | Rank | Median Earnings |
| Hondurans | 0.0 /100 | #307 | Tragic $40,638 |
| Cubans | 0.0 /100 | #308 | Tragic $40,619 |
| Immigrants | Haiti | 0.0 /100 | #309 | Tragic $40,550 |
| Apache | 0.0 /100 | #310 | Tragic $40,388 |
| Hispanics or Latinos | 0.0 /100 | #311 | Tragic $40,288 |
| Chippewa | 0.0 /100 | #312 | Tragic $40,287 |
| Choctaw | 0.0 /100 | #313 | Tragic $40,270 |
| Cheyenne | 0.0 /100 | #314 | Tragic $40,233 |
| Seminole | 0.0 /100 | #315 | Tragic $40,233 |
| Immigrants | Honduras | 0.0 /100 | #316 | Tragic $40,195 |
| Fijians | 0.0 /100 | #317 | Tragic $40,193 |
| Dutch West Indians | 0.0 /100 | #318 | Tragic $40,107 |
| Blacks/African Americans | 0.0 /100 | #319 | Tragic $40,085 |
| Immigrants | Bahamas | 0.0 /100 | #320 | Tragic $39,861 |
| Mexicans | 0.0 /100 | #321 | Tragic $39,834 |