Dominican vs Colombian Median Earnings
COMPARE
Dominican
Colombian
Median Earnings
Median Earnings Comparison
Dominicans
Colombians
$41,864
MEDIAN EARNINGS
0.2/ 100
METRIC RATING
283rd/ 347
METRIC RANK
$46,349
MEDIAN EARNINGS
47.1/ 100
METRIC RATING
178th/ 347
METRIC RANK
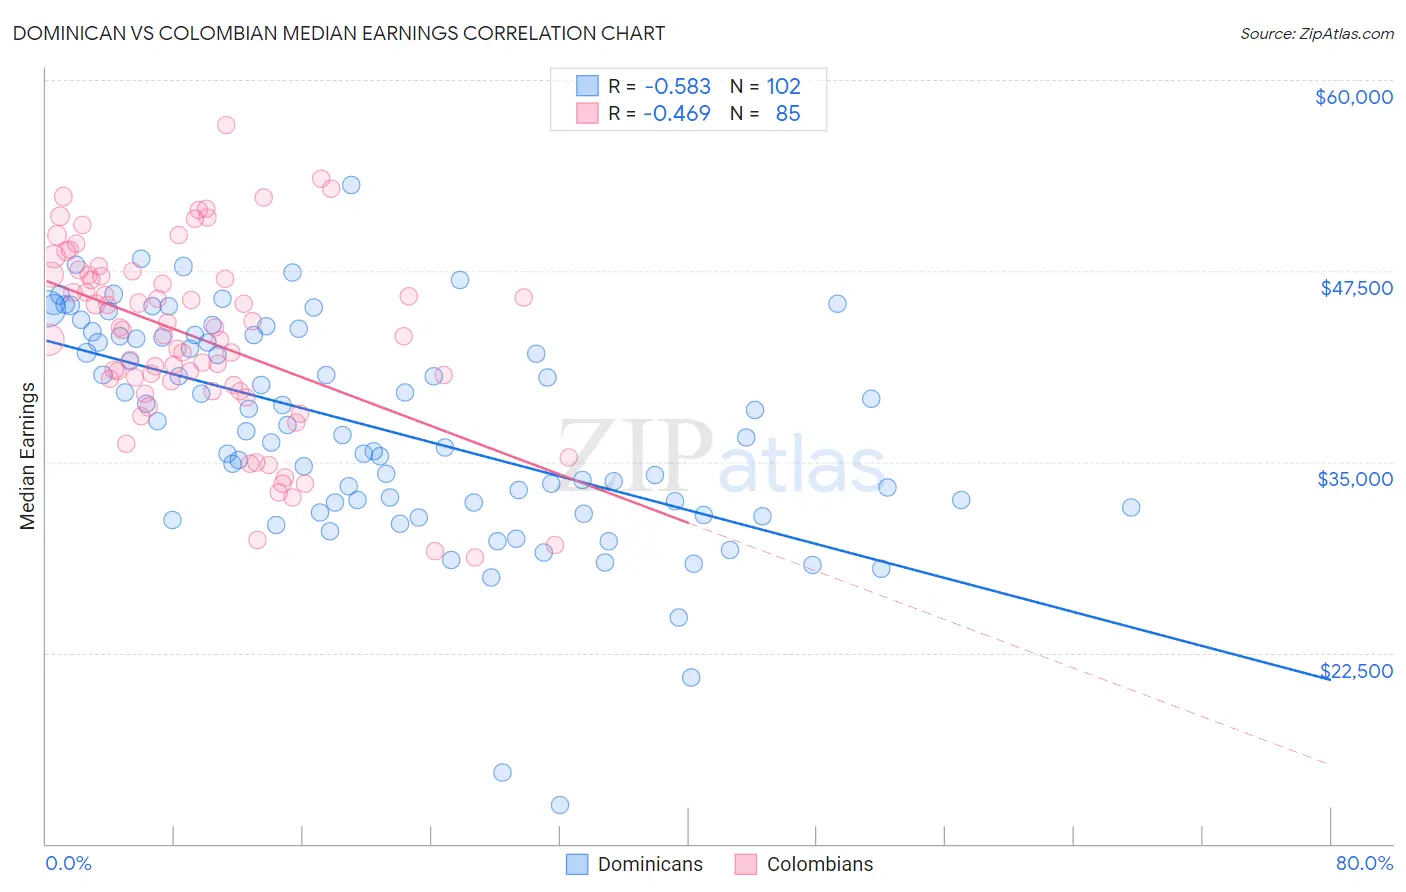
Dominican vs Colombian Median Earnings Correlation Chart
The statistical analysis conducted on geographies consisting of 355,132,428 people shows a substantial negative correlation between the proportion of Dominicans and median earnings in the United States with a correlation coefficient (R) of -0.583 and weighted average of $41,864. Similarly, the statistical analysis conducted on geographies consisting of 419,670,347 people shows a moderate negative correlation between the proportion of Colombians and median earnings in the United States with a correlation coefficient (R) of -0.469 and weighted average of $46,349, a difference of 10.7%.
Median Earnings Correlation Summary
| Measurement | Dominican | Colombian |
| Minimum | $12,552 | $28,750 |
| Maximum | $53,134 | $57,032 |
| Range | $40,582 | $28,282 |
| Mean | $37,192 | $43,048 |
| Median | $37,213 | $43,271 |
| Interquartile 25% (IQ1) | $32,338 | $39,637 |
| Interquartile 75% (IQ3) | $43,235 | $47,254 |
| Interquartile Range (IQR) | $10,898 | $7,617 |
| Standard Deviation (Sample) | $7,182 | $6,158 |
| Standard Deviation (Population) | $7,146 | $6,121 |
Similar Demographics by Median Earnings
Demographics Similar to Dominicans by Median Earnings
In terms of median earnings, the demographic groups most similar to Dominicans are Blackfeet ($41,822, a difference of 0.10%), African ($41,955, a difference of 0.22%), Marshallese ($41,969, a difference of 0.25%), Immigrants from Nicaragua ($41,737, a difference of 0.31%), and Mexican American Indian ($41,719, a difference of 0.35%).
| Demographics | Rating | Rank | Median Earnings |
| Spanish Americans | 0.3 /100 | #276 | Tragic $42,316 |
| Central Americans | 0.3 /100 | #277 | Tragic $42,280 |
| Cajuns | 0.3 /100 | #278 | Tragic $42,189 |
| Colville | 0.2 /100 | #279 | Tragic $42,151 |
| Hmong | 0.2 /100 | #280 | Tragic $42,111 |
| Marshallese | 0.2 /100 | #281 | Tragic $41,969 |
| Africans | 0.2 /100 | #282 | Tragic $41,955 |
| Dominicans | 0.2 /100 | #283 | Tragic $41,864 |
| Blackfeet | 0.2 /100 | #284 | Tragic $41,822 |
| Immigrants | Nicaragua | 0.1 /100 | #285 | Tragic $41,737 |
| Mexican American Indians | 0.1 /100 | #286 | Tragic $41,719 |
| Indonesians | 0.1 /100 | #287 | Tragic $41,701 |
| Immigrants | Dominican Republic | 0.1 /100 | #288 | Tragic $41,554 |
| Comanche | 0.1 /100 | #289 | Tragic $41,519 |
| Paiute | 0.1 /100 | #290 | Tragic $41,508 |
Demographics Similar to Colombians by Median Earnings
In terms of median earnings, the demographic groups most similar to Colombians are English ($46,334, a difference of 0.030%), Puget Sound Salish ($46,333, a difference of 0.040%), Immigrants from Cameroon ($46,329, a difference of 0.040%), Belgian ($46,375, a difference of 0.060%), and Swiss ($46,315, a difference of 0.070%).
| Demographics | Rating | Rank | Median Earnings |
| Scottish | 51.1 /100 | #171 | Average $46,463 |
| Kenyans | 51.0 /100 | #172 | Average $46,462 |
| Ghanaians | 50.3 /100 | #173 | Average $46,440 |
| Scandinavians | 50.0 /100 | #174 | Average $46,433 |
| Basques | 48.8 /100 | #175 | Average $46,399 |
| Danes | 48.6 /100 | #176 | Average $46,392 |
| Belgians | 48.0 /100 | #177 | Average $46,375 |
| Colombians | 47.1 /100 | #178 | Average $46,349 |
| English | 46.5 /100 | #179 | Average $46,334 |
| Puget Sound Salish | 46.5 /100 | #180 | Average $46,333 |
| Immigrants | Cameroon | 46.4 /100 | #181 | Average $46,329 |
| Swiss | 45.9 /100 | #182 | Average $46,315 |
| French | 45.2 /100 | #183 | Average $46,296 |
| Immigrants | Kenya | 42.4 /100 | #184 | Average $46,214 |
| Uruguayans | 41.6 /100 | #185 | Average $46,190 |