Dominican vs U.S. Virgin Islander Median Earnings
COMPARE
Dominican
U.S. Virgin Islander
Median Earnings
Median Earnings Comparison
Dominicans
U.S. Virgin Islanders
$41,864
MEDIAN EARNINGS
0.2/ 100
METRIC RATING
283rd/ 347
METRIC RANK
$41,448
MEDIAN EARNINGS
0.1/ 100
METRIC RATING
292nd/ 347
METRIC RANK
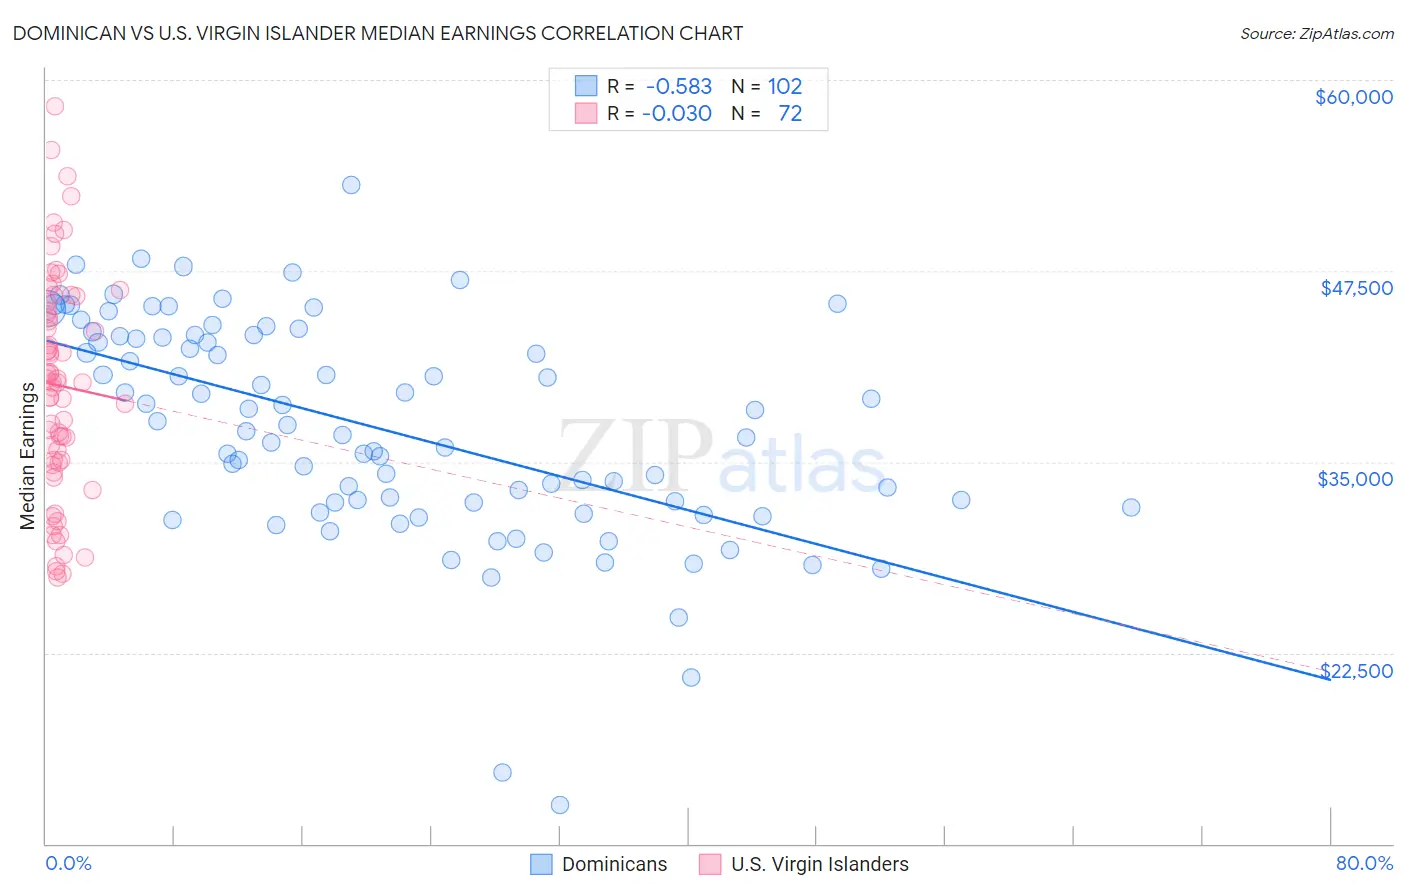
Dominican vs U.S. Virgin Islander Median Earnings Correlation Chart
The statistical analysis conducted on geographies consisting of 355,132,428 people shows a substantial negative correlation between the proportion of Dominicans and median earnings in the United States with a correlation coefficient (R) of -0.583 and weighted average of $41,864. Similarly, the statistical analysis conducted on geographies consisting of 87,526,165 people shows no correlation between the proportion of U.S. Virgin Islanders and median earnings in the United States with a correlation coefficient (R) of -0.030 and weighted average of $41,448, a difference of 1.0%.
Median Earnings Correlation Summary
| Measurement | Dominican | U.S. Virgin Islander |
| Minimum | $12,552 | $27,466 |
| Maximum | $53,134 | $58,251 |
| Range | $40,582 | $30,785 |
| Mean | $37,192 | $39,999 |
| Median | $37,213 | $40,206 |
| Interquartile 25% (IQ1) | $32,338 | $35,022 |
| Interquartile 75% (IQ3) | $43,235 | $45,141 |
| Interquartile Range (IQR) | $10,898 | $10,119 |
| Standard Deviation (Sample) | $7,182 | $7,165 |
| Standard Deviation (Population) | $7,146 | $7,115 |
Demographics Similar to Dominicans and U.S. Virgin Islanders by Median Earnings
In terms of median earnings, the demographic groups most similar to Dominicans are Blackfeet ($41,822, a difference of 0.10%), African ($41,955, a difference of 0.22%), Marshallese ($41,969, a difference of 0.25%), Immigrants from Nicaragua ($41,737, a difference of 0.31%), and Mexican American Indian ($41,719, a difference of 0.35%). Similarly, the demographic groups most similar to U.S. Virgin Islanders are Central American Indian ($41,474, a difference of 0.060%), Paiute ($41,508, a difference of 0.15%), Comanche ($41,519, a difference of 0.17%), Immigrants from Dominican Republic ($41,554, a difference of 0.26%), and Immigrants from Zaire ($41,325, a difference of 0.30%).
| Demographics | Rating | Rank | Median Earnings |
| Central Americans | 0.3 /100 | #277 | Tragic $42,280 |
| Cajuns | 0.3 /100 | #278 | Tragic $42,189 |
| Colville | 0.2 /100 | #279 | Tragic $42,151 |
| Hmong | 0.2 /100 | #280 | Tragic $42,111 |
| Marshallese | 0.2 /100 | #281 | Tragic $41,969 |
| Africans | 0.2 /100 | #282 | Tragic $41,955 |
| Dominicans | 0.2 /100 | #283 | Tragic $41,864 |
| Blackfeet | 0.2 /100 | #284 | Tragic $41,822 |
| Immigrants | Nicaragua | 0.1 /100 | #285 | Tragic $41,737 |
| Mexican American Indians | 0.1 /100 | #286 | Tragic $41,719 |
| Indonesians | 0.1 /100 | #287 | Tragic $41,701 |
| Immigrants | Dominican Republic | 0.1 /100 | #288 | Tragic $41,554 |
| Comanche | 0.1 /100 | #289 | Tragic $41,519 |
| Paiute | 0.1 /100 | #290 | Tragic $41,508 |
| Central American Indians | 0.1 /100 | #291 | Tragic $41,474 |
| U.S. Virgin Islanders | 0.1 /100 | #292 | Tragic $41,448 |
| Immigrants | Zaire | 0.1 /100 | #293 | Tragic $41,325 |
| Potawatomi | 0.1 /100 | #294 | Tragic $41,288 |
| Bangladeshis | 0.1 /100 | #295 | Tragic $41,263 |
| Cherokee | 0.1 /100 | #296 | Tragic $41,252 |
| Guatemalans | 0.1 /100 | #297 | Tragic $41,205 |