Dominican vs Somali Median Earnings
COMPARE
Dominican
Somali
Median Earnings
Median Earnings Comparison
Dominicans
Somalis
$41,864
MEDIAN EARNINGS
0.2/ 100
METRIC RATING
283rd/ 347
METRIC RANK
$43,567
MEDIAN EARNINGS
1.8/ 100
METRIC RATING
253rd/ 347
METRIC RANK
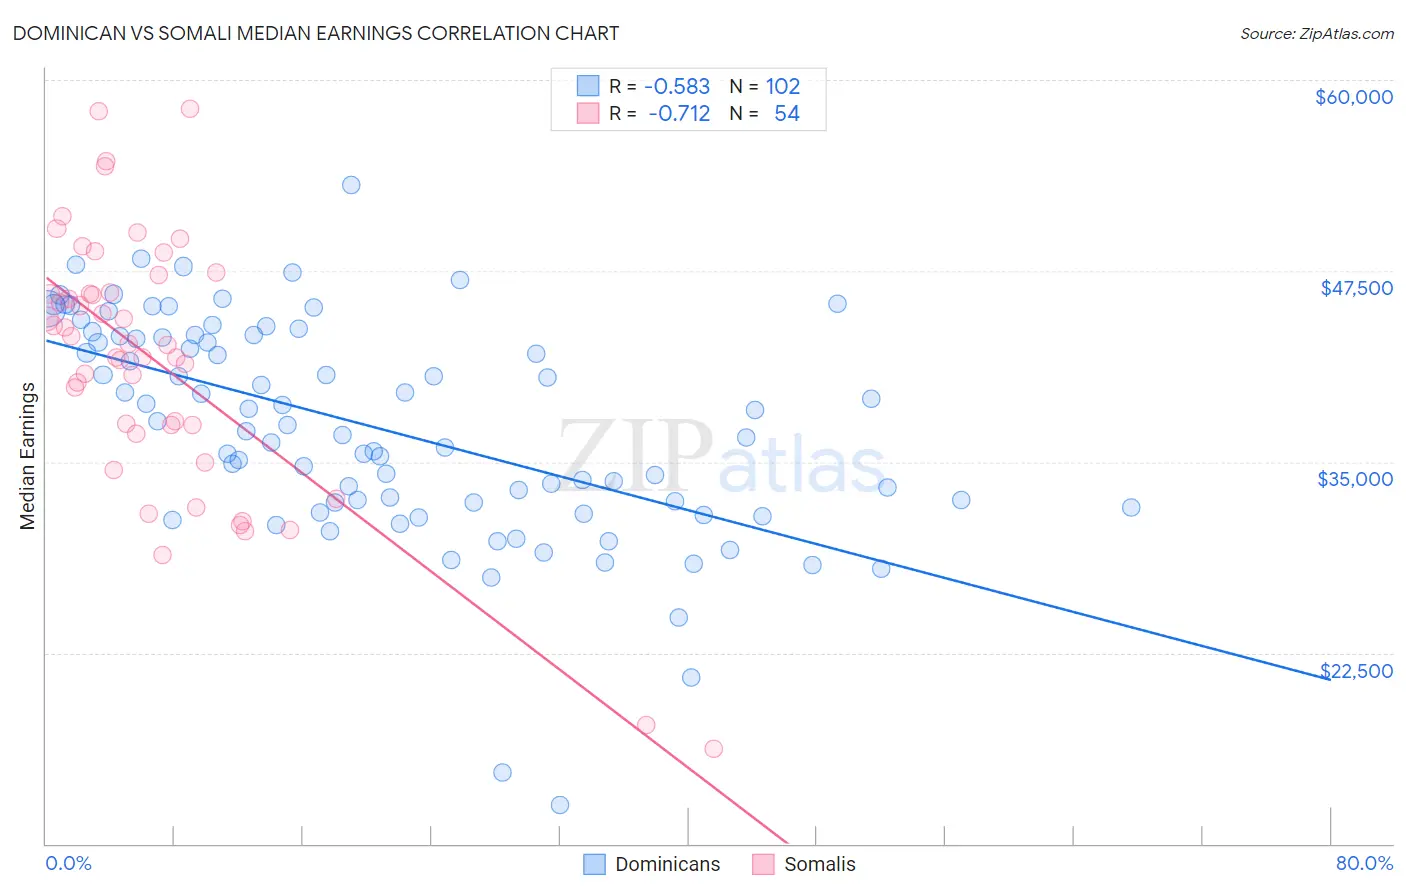
Dominican vs Somali Median Earnings Correlation Chart
The statistical analysis conducted on geographies consisting of 355,132,428 people shows a substantial negative correlation between the proportion of Dominicans and median earnings in the United States with a correlation coefficient (R) of -0.583 and weighted average of $41,864. Similarly, the statistical analysis conducted on geographies consisting of 99,321,613 people shows a strong negative correlation between the proportion of Somalis and median earnings in the United States with a correlation coefficient (R) of -0.712 and weighted average of $43,567, a difference of 4.1%.
Median Earnings Correlation Summary
| Measurement | Dominican | Somali |
| Minimum | $12,552 | $16,214 |
| Maximum | $53,134 | $58,125 |
| Range | $40,582 | $41,911 |
| Mean | $37,192 | $41,593 |
| Median | $37,213 | $42,677 |
| Interquartile 25% (IQ1) | $32,338 | $37,388 |
| Interquartile 75% (IQ3) | $43,235 | $46,056 |
| Interquartile Range (IQR) | $10,898 | $8,668 |
| Standard Deviation (Sample) | $7,182 | $8,542 |
| Standard Deviation (Population) | $7,146 | $8,463 |
Similar Demographics by Median Earnings
Demographics Similar to Dominicans by Median Earnings
In terms of median earnings, the demographic groups most similar to Dominicans are Blackfeet ($41,822, a difference of 0.10%), African ($41,955, a difference of 0.22%), Marshallese ($41,969, a difference of 0.25%), Immigrants from Nicaragua ($41,737, a difference of 0.31%), and Mexican American Indian ($41,719, a difference of 0.35%).
| Demographics | Rating | Rank | Median Earnings |
| Spanish Americans | 0.3 /100 | #276 | Tragic $42,316 |
| Central Americans | 0.3 /100 | #277 | Tragic $42,280 |
| Cajuns | 0.3 /100 | #278 | Tragic $42,189 |
| Colville | 0.2 /100 | #279 | Tragic $42,151 |
| Hmong | 0.2 /100 | #280 | Tragic $42,111 |
| Marshallese | 0.2 /100 | #281 | Tragic $41,969 |
| Africans | 0.2 /100 | #282 | Tragic $41,955 |
| Dominicans | 0.2 /100 | #283 | Tragic $41,864 |
| Blackfeet | 0.2 /100 | #284 | Tragic $41,822 |
| Immigrants | Nicaragua | 0.1 /100 | #285 | Tragic $41,737 |
| Mexican American Indians | 0.1 /100 | #286 | Tragic $41,719 |
| Indonesians | 0.1 /100 | #287 | Tragic $41,701 |
| Immigrants | Dominican Republic | 0.1 /100 | #288 | Tragic $41,554 |
| Comanche | 0.1 /100 | #289 | Tragic $41,519 |
| Paiute | 0.1 /100 | #290 | Tragic $41,508 |
Demographics Similar to Somalis by Median Earnings
In terms of median earnings, the demographic groups most similar to Somalis are Liberian ($43,536, a difference of 0.070%), Hawaiian ($43,673, a difference of 0.24%), Tsimshian ($43,695, a difference of 0.30%), Immigrants from Middle Africa ($43,416, a difference of 0.35%), and Alaskan Athabascan ($43,393, a difference of 0.40%).
| Demographics | Rating | Rank | Median Earnings |
| Immigrants | West Indies | 3.1 /100 | #246 | Tragic $43,989 |
| Immigrants | Cabo Verde | 3.0 /100 | #247 | Tragic $43,963 |
| Nepalese | 2.6 /100 | #248 | Tragic $43,860 |
| Malaysians | 2.6 /100 | #249 | Tragic $43,844 |
| Alaska Natives | 2.3 /100 | #250 | Tragic $43,750 |
| Tsimshian | 2.1 /100 | #251 | Tragic $43,695 |
| Hawaiians | 2.0 /100 | #252 | Tragic $43,673 |
| Somalis | 1.8 /100 | #253 | Tragic $43,567 |
| Liberians | 1.7 /100 | #254 | Tragic $43,536 |
| Immigrants | Middle Africa | 1.4 /100 | #255 | Tragic $43,416 |
| Alaskan Athabascans | 1.4 /100 | #256 | Tragic $43,393 |
| Jamaicans | 1.3 /100 | #257 | Tragic $43,343 |
| French American Indians | 1.3 /100 | #258 | Tragic $43,333 |
| German Russians | 1.1 /100 | #259 | Tragic $43,200 |
| Immigrants | Somalia | 0.9 /100 | #260 | Tragic $43,100 |