Tlingit-Haida vs Cheyenne Median Earnings
COMPARE
Tlingit-Haida
Cheyenne
Median Earnings
Median Earnings Comparison
Tlingit-Haida
Cheyenne
$45,468
MEDIAN EARNINGS
20.5/ 100
METRIC RATING
217th/ 347
METRIC RANK
$40,233
MEDIAN EARNINGS
0.0/ 100
METRIC RATING
314th/ 347
METRIC RANK
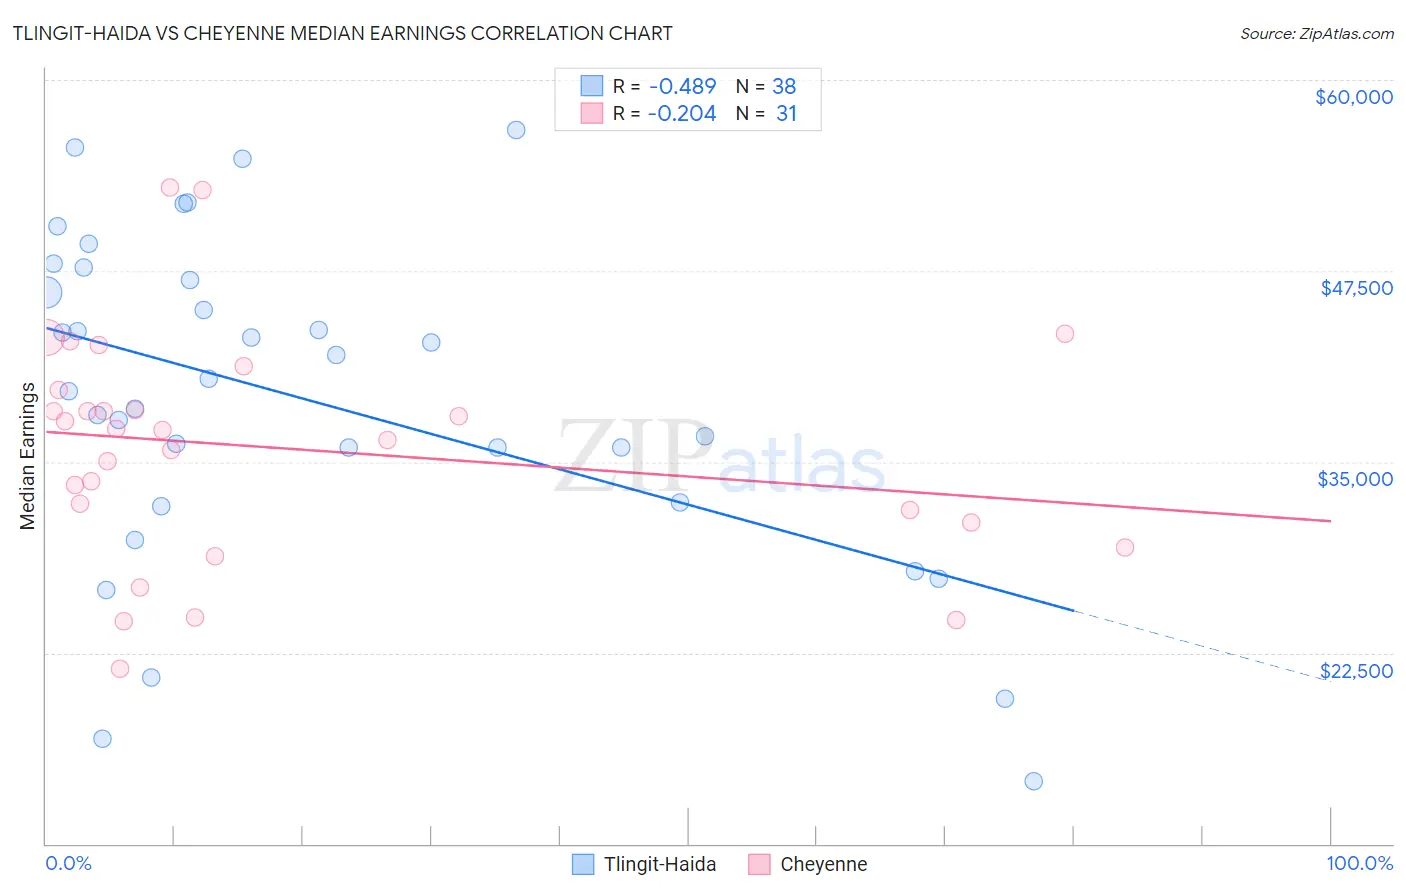
Tlingit-Haida vs Cheyenne Median Earnings Correlation Chart
The statistical analysis conducted on geographies consisting of 60,865,073 people shows a moderate negative correlation between the proportion of Tlingit-Haida and median earnings in the United States with a correlation coefficient (R) of -0.489 and weighted average of $45,468. Similarly, the statistical analysis conducted on geographies consisting of 80,717,230 people shows a weak negative correlation between the proportion of Cheyenne and median earnings in the United States with a correlation coefficient (R) of -0.204 and weighted average of $40,233, a difference of 13.0%.
Median Earnings Correlation Summary
| Measurement | Tlingit-Haida | Cheyenne |
| Minimum | $14,091 | $21,433 |
| Maximum | $56,765 | $52,964 |
| Range | $42,674 | $31,531 |
| Mean | $39,098 | $35,877 |
| Median | $40,018 | $37,115 |
| Interquartile 25% (IQ1) | $32,344 | $31,011 |
| Interquartile 75% (IQ3) | $46,917 | $39,717 |
| Interquartile Range (IQR) | $14,573 | $8,706 |
| Standard Deviation (Sample) | $10,751 | $7,496 |
| Standard Deviation (Population) | $10,609 | $7,374 |
Similar Demographics by Median Earnings
Demographics Similar to Tlingit-Haida by Median Earnings
In terms of median earnings, the demographic groups most similar to Tlingit-Haida are Guyanese ($45,470, a difference of 0.0%), Spanish ($45,432, a difference of 0.080%), Nigerian ($45,532, a difference of 0.14%), Immigrants from Bangladesh ($45,532, a difference of 0.14%), and Immigrants from Colombia ($45,550, a difference of 0.18%).
| Demographics | Rating | Rank | Median Earnings |
| Immigrants | Grenada | 23.6 /100 | #210 | Fair $45,596 |
| Panamanians | 23.5 /100 | #211 | Fair $45,593 |
| Bermudans | 23.5 /100 | #212 | Fair $45,593 |
| Immigrants | Colombia | 22.4 /100 | #213 | Fair $45,550 |
| Nigerians | 22.0 /100 | #214 | Fair $45,532 |
| Immigrants | Bangladesh | 22.0 /100 | #215 | Fair $45,532 |
| Guyanese | 20.6 /100 | #216 | Fair $45,470 |
| Tlingit-Haida | 20.5 /100 | #217 | Fair $45,468 |
| Spanish | 19.7 /100 | #218 | Poor $45,432 |
| Dutch | 18.4 /100 | #219 | Poor $45,370 |
| Ecuadorians | 15.3 /100 | #220 | Poor $45,214 |
| Immigrants | Guyana | 15.1 /100 | #221 | Poor $45,204 |
| Immigrants | Panama | 15.0 /100 | #222 | Poor $45,198 |
| Whites/Caucasians | 15.0 /100 | #223 | Poor $45,197 |
| West Indians | 13.9 /100 | #224 | Poor $45,132 |
Demographics Similar to Cheyenne by Median Earnings
In terms of median earnings, the demographic groups most similar to Cheyenne are Seminole ($40,233, a difference of 0.0%), Choctaw ($40,270, a difference of 0.090%), Immigrants from Honduras ($40,195, a difference of 0.10%), Fijian ($40,193, a difference of 0.10%), and Chippewa ($40,287, a difference of 0.13%).
| Demographics | Rating | Rank | Median Earnings |
| Hondurans | 0.0 /100 | #307 | Tragic $40,638 |
| Cubans | 0.0 /100 | #308 | Tragic $40,619 |
| Immigrants | Haiti | 0.0 /100 | #309 | Tragic $40,550 |
| Apache | 0.0 /100 | #310 | Tragic $40,388 |
| Hispanics or Latinos | 0.0 /100 | #311 | Tragic $40,288 |
| Chippewa | 0.0 /100 | #312 | Tragic $40,287 |
| Choctaw | 0.0 /100 | #313 | Tragic $40,270 |
| Cheyenne | 0.0 /100 | #314 | Tragic $40,233 |
| Seminole | 0.0 /100 | #315 | Tragic $40,233 |
| Immigrants | Honduras | 0.0 /100 | #316 | Tragic $40,195 |
| Fijians | 0.0 /100 | #317 | Tragic $40,193 |
| Dutch West Indians | 0.0 /100 | #318 | Tragic $40,107 |
| Blacks/African Americans | 0.0 /100 | #319 | Tragic $40,085 |
| Immigrants | Bahamas | 0.0 /100 | #320 | Tragic $39,861 |
| Mexicans | 0.0 /100 | #321 | Tragic $39,834 |