Immigrants from Sweden vs Cheyenne Median Earnings
COMPARE
Immigrants from Sweden
Cheyenne
Median Earnings
Median Earnings Comparison
Immigrants from Sweden
Cheyenne
$54,478
MEDIAN EARNINGS
100.0/ 100
METRIC RATING
23rd/ 347
METRIC RANK
$40,233
MEDIAN EARNINGS
0.0/ 100
METRIC RATING
314th/ 347
METRIC RANK
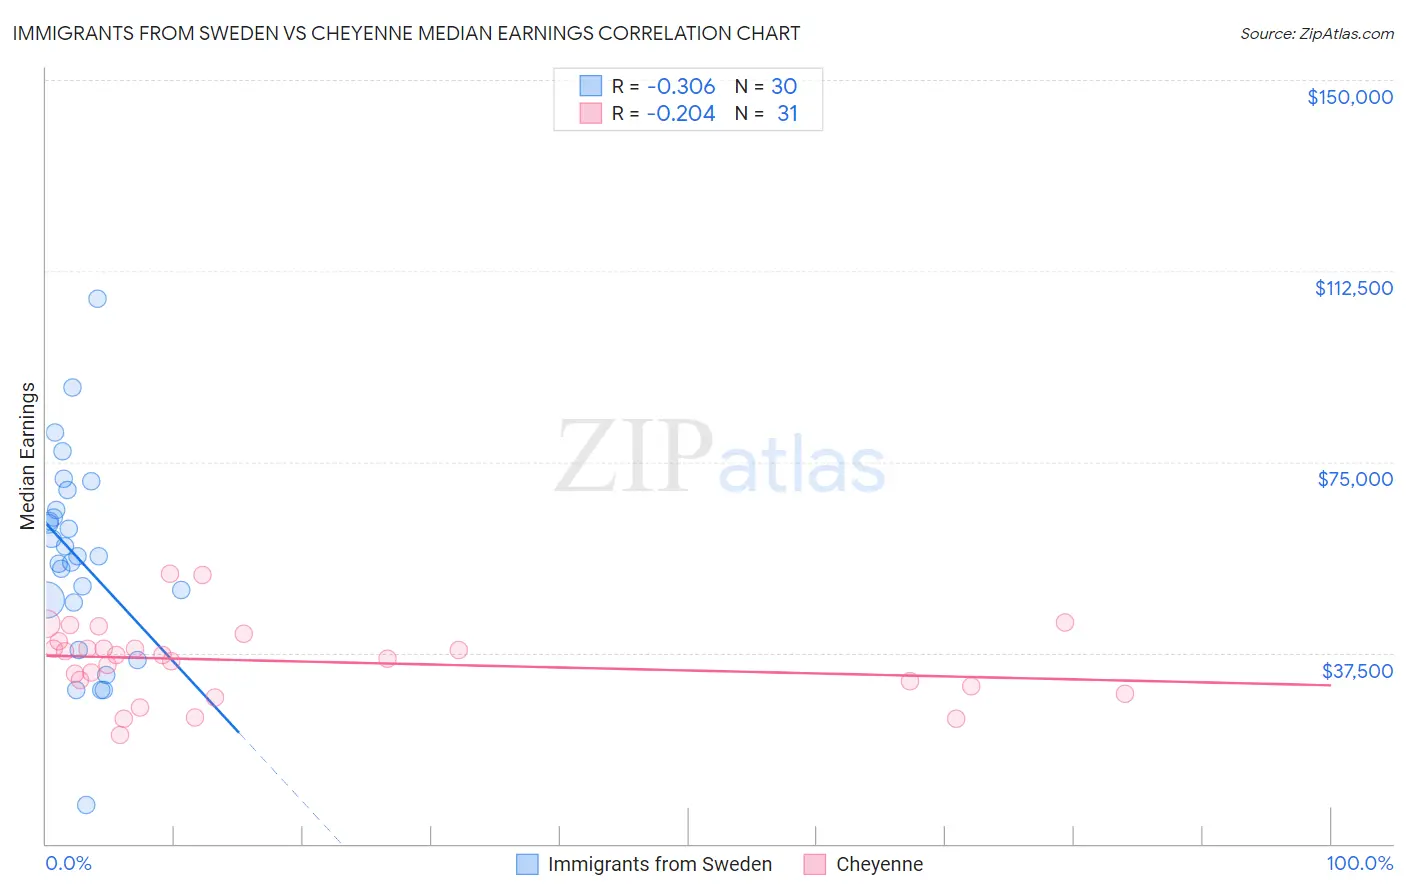
Immigrants from Sweden vs Cheyenne Median Earnings Correlation Chart
The statistical analysis conducted on geographies consisting of 164,745,494 people shows a mild negative correlation between the proportion of Immigrants from Sweden and median earnings in the United States with a correlation coefficient (R) of -0.306 and weighted average of $54,478. Similarly, the statistical analysis conducted on geographies consisting of 80,717,230 people shows a weak negative correlation between the proportion of Cheyenne and median earnings in the United States with a correlation coefficient (R) of -0.204 and weighted average of $40,233, a difference of 35.4%.
Median Earnings Correlation Summary
| Measurement | Immigrants from Sweden | Cheyenne |
| Minimum | $7,643 | $21,433 |
| Maximum | $106,979 | $52,964 |
| Range | $99,336 | $31,531 |
| Mean | $56,044 | $35,877 |
| Median | $56,394 | $37,115 |
| Interquartile 25% (IQ1) | $47,341 | $31,011 |
| Interquartile 75% (IQ3) | $65,578 | $39,717 |
| Interquartile Range (IQR) | $18,237 | $8,706 |
| Standard Deviation (Sample) | $19,951 | $7,496 |
| Standard Deviation (Population) | $19,616 | $7,374 |
Similar Demographics by Median Earnings
Demographics Similar to Immigrants from Sweden by Median Earnings
In terms of median earnings, the demographic groups most similar to Immigrants from Sweden are Immigrants from Korea ($54,530, a difference of 0.10%), Burmese ($54,559, a difference of 0.15%), Cypriot ($54,589, a difference of 0.20%), Soviet Union ($54,290, a difference of 0.35%), and Immigrants from Belgium ($54,679, a difference of 0.37%).
| Demographics | Rating | Rank | Median Earnings |
| Immigrants | Eastern Asia | 100.0 /100 | #16 | Exceptional $56,183 |
| Eastern Europeans | 100.0 /100 | #17 | Exceptional $55,084 |
| Immigrants | Japan | 100.0 /100 | #18 | Exceptional $54,938 |
| Immigrants | Belgium | 100.0 /100 | #19 | Exceptional $54,679 |
| Cypriots | 100.0 /100 | #20 | Exceptional $54,589 |
| Burmese | 100.0 /100 | #21 | Exceptional $54,559 |
| Immigrants | Korea | 100.0 /100 | #22 | Exceptional $54,530 |
| Immigrants | Sweden | 100.0 /100 | #23 | Exceptional $54,478 |
| Soviet Union | 100.0 /100 | #24 | Exceptional $54,290 |
| Turks | 100.0 /100 | #25 | Exceptional $53,919 |
| Immigrants | Northern Europe | 100.0 /100 | #26 | Exceptional $53,872 |
| Asians | 100.0 /100 | #27 | Exceptional $53,690 |
| Immigrants | France | 100.0 /100 | #28 | Exceptional $53,490 |
| Immigrants | Russia | 100.0 /100 | #29 | Exceptional $53,457 |
| Cambodians | 100.0 /100 | #30 | Exceptional $53,386 |
Demographics Similar to Cheyenne by Median Earnings
In terms of median earnings, the demographic groups most similar to Cheyenne are Seminole ($40,233, a difference of 0.0%), Choctaw ($40,270, a difference of 0.090%), Immigrants from Honduras ($40,195, a difference of 0.10%), Fijian ($40,193, a difference of 0.10%), and Chippewa ($40,287, a difference of 0.13%).
| Demographics | Rating | Rank | Median Earnings |
| Hondurans | 0.0 /100 | #307 | Tragic $40,638 |
| Cubans | 0.0 /100 | #308 | Tragic $40,619 |
| Immigrants | Haiti | 0.0 /100 | #309 | Tragic $40,550 |
| Apache | 0.0 /100 | #310 | Tragic $40,388 |
| Hispanics or Latinos | 0.0 /100 | #311 | Tragic $40,288 |
| Chippewa | 0.0 /100 | #312 | Tragic $40,287 |
| Choctaw | 0.0 /100 | #313 | Tragic $40,270 |
| Cheyenne | 0.0 /100 | #314 | Tragic $40,233 |
| Seminole | 0.0 /100 | #315 | Tragic $40,233 |
| Immigrants | Honduras | 0.0 /100 | #316 | Tragic $40,195 |
| Fijians | 0.0 /100 | #317 | Tragic $40,193 |
| Dutch West Indians | 0.0 /100 | #318 | Tragic $40,107 |
| Blacks/African Americans | 0.0 /100 | #319 | Tragic $40,085 |
| Immigrants | Bahamas | 0.0 /100 | #320 | Tragic $39,861 |
| Mexicans | 0.0 /100 | #321 | Tragic $39,834 |