Dominican vs Cheyenne High School Diploma
COMPARE
Dominican
Cheyenne
High School Diploma
High School Diploma Comparison
Dominicans
Cheyenne
82.9%
HIGH SCHOOL DIPLOMA
0.0/ 100
METRIC RATING
328th/ 347
METRIC RANK
87.8%
HIGH SCHOOL DIPLOMA
2.1/ 100
METRIC RATING
242nd/ 347
METRIC RANK
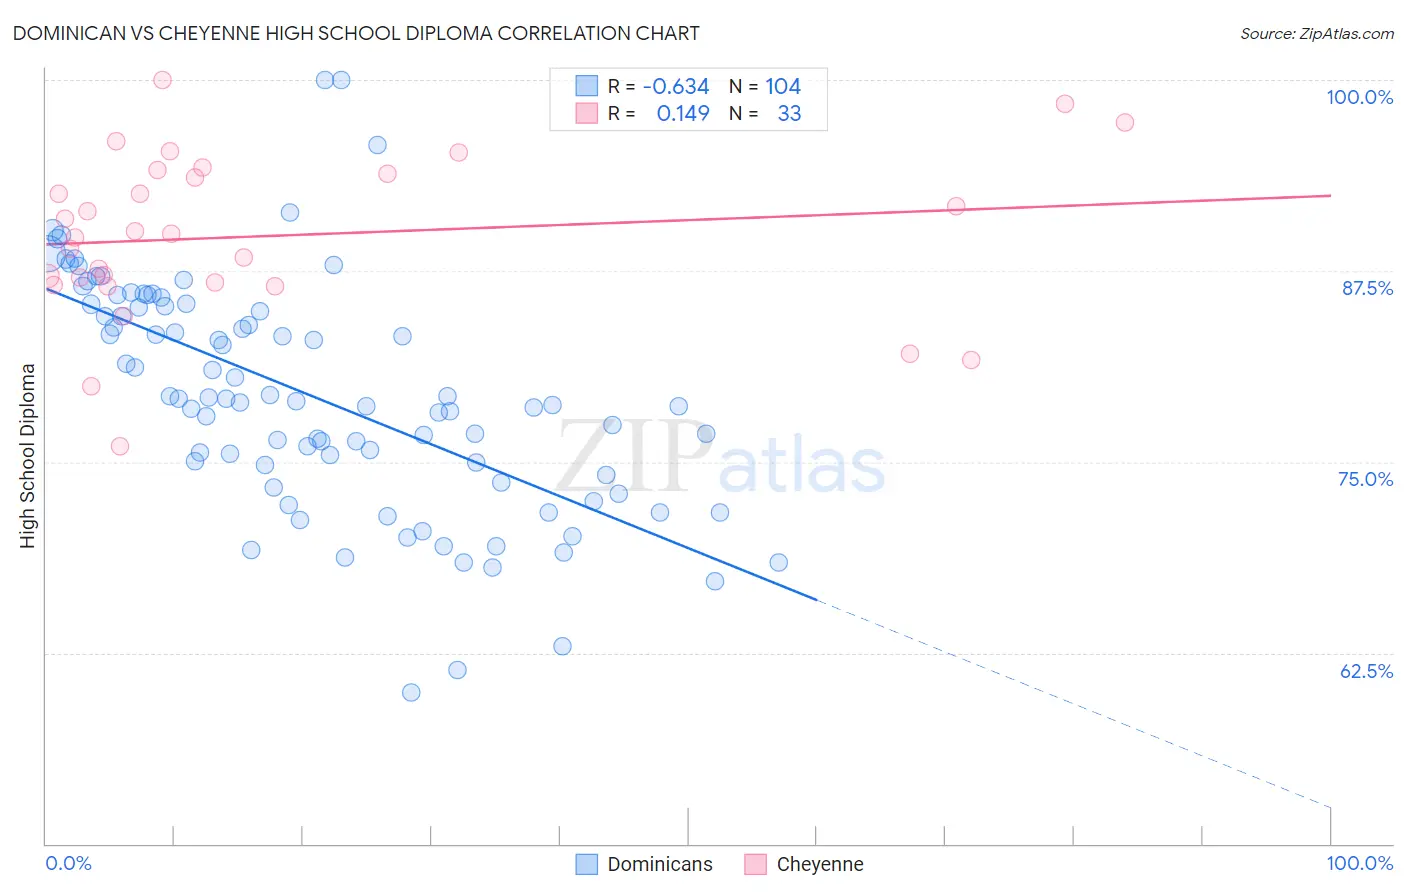
Dominican vs Cheyenne High School Diploma Correlation Chart
The statistical analysis conducted on geographies consisting of 355,143,036 people shows a significant negative correlation between the proportion of Dominicans and percentage of population with at least high school diploma education in the United States with a correlation coefficient (R) of -0.634 and weighted average of 82.9%. Similarly, the statistical analysis conducted on geographies consisting of 80,719,287 people shows a poor positive correlation between the proportion of Cheyenne and percentage of population with at least high school diploma education in the United States with a correlation coefficient (R) of 0.149 and weighted average of 87.8%, a difference of 5.9%.
High School Diploma Correlation Summary
| Measurement | Dominican | Cheyenne |
| Minimum | 59.9% | 76.1% |
| Maximum | 100.0% | 100.0% |
| Range | 40.1% | 23.9% |
| Mean | 79.4% | 89.8% |
| Median | 79.0% | 90.0% |
| Interquartile 25% (IQ1) | 74.5% | 86.7% |
| Interquartile 75% (IQ3) | 85.3% | 94.0% |
| Interquartile Range (IQR) | 10.8% | 7.3% |
| Standard Deviation (Sample) | 7.6% | 5.4% |
| Standard Deviation (Population) | 7.6% | 5.3% |
Similar Demographics by High School Diploma
Demographics Similar to Dominicans by High School Diploma
In terms of high school diploma, the demographic groups most similar to Dominicans are Honduran (83.0%, a difference of 0.050%), Mexican American Indian (83.0%, a difference of 0.090%), Hispanic or Latino (82.9%, a difference of 0.10%), Immigrants from Nicaragua (83.1%, a difference of 0.16%), and Immigrants from the Azores (82.8%, a difference of 0.17%).
| Demographics | Rating | Rank | High School Diploma |
| Yuman | 0.0 /100 | #321 | Tragic 84.0% |
| Lumbee | 0.0 /100 | #322 | Tragic 83.6% |
| Immigrants | Cuba | 0.0 /100 | #323 | Tragic 83.5% |
| Immigrants | Cabo Verde | 0.0 /100 | #324 | Tragic 83.3% |
| Immigrants | Nicaragua | 0.0 /100 | #325 | Tragic 83.1% |
| Mexican American Indians | 0.0 /100 | #326 | Tragic 83.0% |
| Hondurans | 0.0 /100 | #327 | Tragic 83.0% |
| Dominicans | 0.0 /100 | #328 | Tragic 82.9% |
| Hispanics or Latinos | 0.0 /100 | #329 | Tragic 82.9% |
| Immigrants | Azores | 0.0 /100 | #330 | Tragic 82.8% |
| Central Americans | 0.0 /100 | #331 | Tragic 82.5% |
| Immigrants | Honduras | 0.0 /100 | #332 | Tragic 82.5% |
| Immigrants | Latin America | 0.0 /100 | #333 | Tragic 82.1% |
| Tohono O'odham | 0.0 /100 | #334 | Tragic 82.1% |
| Guatemalans | 0.0 /100 | #335 | Tragic 82.0% |
Demographics Similar to Cheyenne by High School Diploma
In terms of high school diploma, the demographic groups most similar to Cheyenne are Immigrants from Uzbekistan (87.8%, a difference of 0.0%), Immigrants from Philippines (87.8%, a difference of 0.020%), Comanche (87.9%, a difference of 0.030%), Choctaw (87.8%, a difference of 0.030%), and Peruvian (87.8%, a difference of 0.040%).
| Demographics | Rating | Rank | High School Diploma |
| Immigrants | Bahamas | 2.9 /100 | #235 | Tragic 88.0% |
| Sub-Saharan Africans | 2.8 /100 | #236 | Tragic 87.9% |
| Taiwanese | 2.8 /100 | #237 | Tragic 87.9% |
| Sioux | 2.7 /100 | #238 | Tragic 87.9% |
| South Americans | 2.7 /100 | #239 | Tragic 87.9% |
| Comanche | 2.2 /100 | #240 | Tragic 87.9% |
| Immigrants | Uzbekistan | 2.1 /100 | #241 | Tragic 87.8% |
| Cheyenne | 2.1 /100 | #242 | Tragic 87.8% |
| Immigrants | Philippines | 1.9 /100 | #243 | Tragic 87.8% |
| Choctaw | 1.9 /100 | #244 | Tragic 87.8% |
| Peruvians | 1.9 /100 | #245 | Tragic 87.8% |
| Immigrants | Eritrea | 1.7 /100 | #246 | Tragic 87.8% |
| Immigrants | Costa Rica | 1.7 /100 | #247 | Tragic 87.8% |
| Spanish Americans | 1.5 /100 | #248 | Tragic 87.7% |
| Senegalese | 1.5 /100 | #249 | Tragic 87.7% |