Dominican vs Yuman Median Earnings
COMPARE
Dominican
Yuman
Median Earnings
Median Earnings Comparison
Dominicans
Yuman
$41,864
MEDIAN EARNINGS
0.2/ 100
METRIC RATING
283rd/ 347
METRIC RANK
$39,523
MEDIAN EARNINGS
0.0/ 100
METRIC RATING
327th/ 347
METRIC RANK
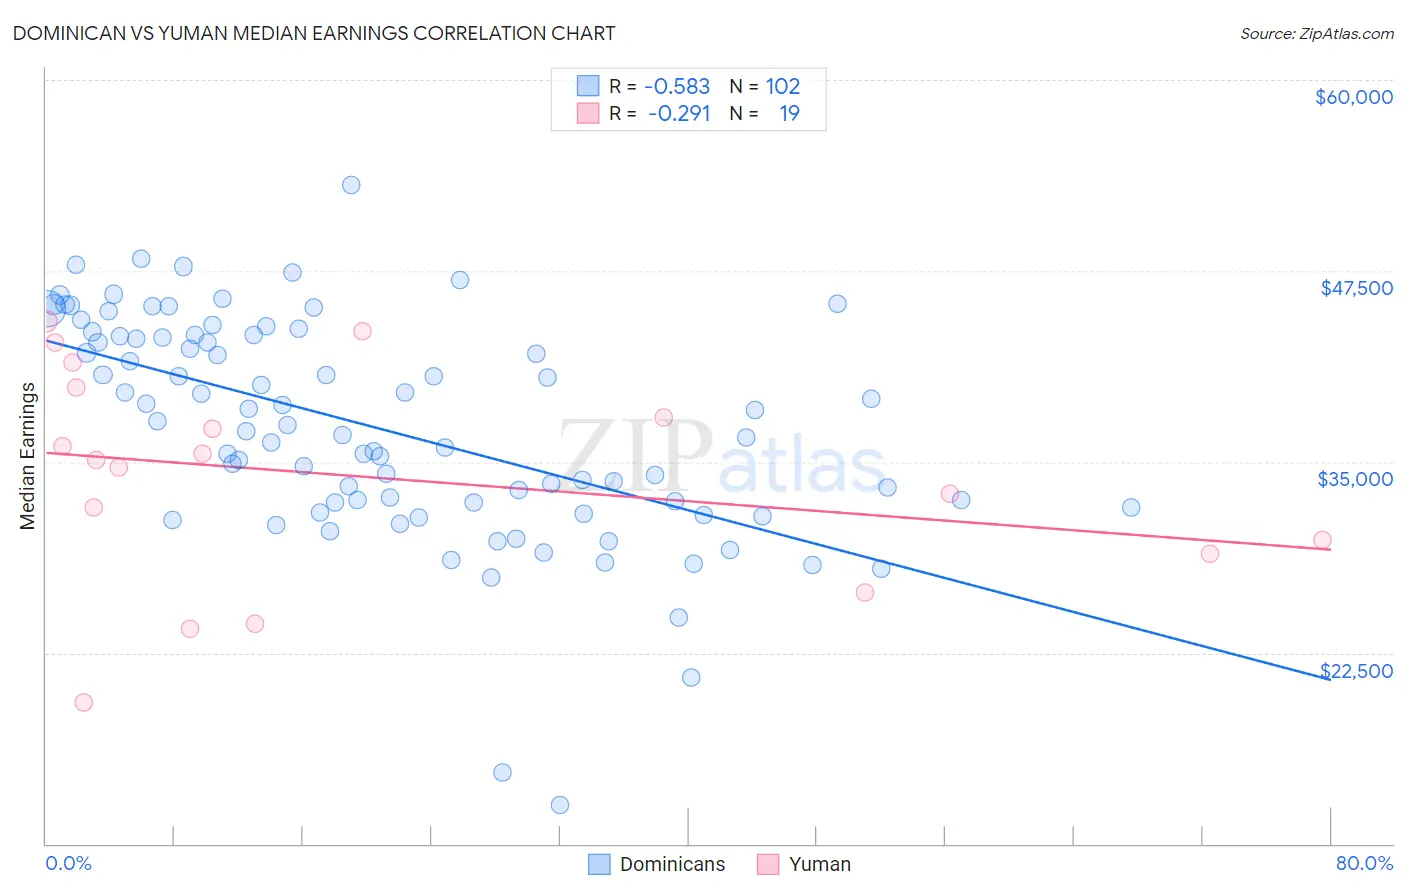
Dominican vs Yuman Median Earnings Correlation Chart
The statistical analysis conducted on geographies consisting of 355,132,428 people shows a substantial negative correlation between the proportion of Dominicans and median earnings in the United States with a correlation coefficient (R) of -0.583 and weighted average of $41,864. Similarly, the statistical analysis conducted on geographies consisting of 40,694,380 people shows a weak negative correlation between the proportion of Yuman and median earnings in the United States with a correlation coefficient (R) of -0.291 and weighted average of $39,523, a difference of 5.9%.
Median Earnings Correlation Summary
| Measurement | Dominican | Yuman |
| Minimum | $12,552 | $19,239 |
| Maximum | $53,134 | $44,204 |
| Range | $40,582 | $24,965 |
| Mean | $37,192 | $34,023 |
| Median | $37,213 | $35,154 |
| Interquartile 25% (IQ1) | $32,338 | $29,007 |
| Interquartile 75% (IQ3) | $43,235 | $39,859 |
| Interquartile Range (IQR) | $10,898 | $10,852 |
| Standard Deviation (Sample) | $7,182 | $7,101 |
| Standard Deviation (Population) | $7,146 | $6,912 |
Similar Demographics by Median Earnings
Demographics Similar to Dominicans by Median Earnings
In terms of median earnings, the demographic groups most similar to Dominicans are Blackfeet ($41,822, a difference of 0.10%), African ($41,955, a difference of 0.22%), Marshallese ($41,969, a difference of 0.25%), Immigrants from Nicaragua ($41,737, a difference of 0.31%), and Mexican American Indian ($41,719, a difference of 0.35%).
| Demographics | Rating | Rank | Median Earnings |
| Spanish Americans | 0.3 /100 | #276 | Tragic $42,316 |
| Central Americans | 0.3 /100 | #277 | Tragic $42,280 |
| Cajuns | 0.3 /100 | #278 | Tragic $42,189 |
| Colville | 0.2 /100 | #279 | Tragic $42,151 |
| Hmong | 0.2 /100 | #280 | Tragic $42,111 |
| Marshallese | 0.2 /100 | #281 | Tragic $41,969 |
| Africans | 0.2 /100 | #282 | Tragic $41,955 |
| Dominicans | 0.2 /100 | #283 | Tragic $41,864 |
| Blackfeet | 0.2 /100 | #284 | Tragic $41,822 |
| Immigrants | Nicaragua | 0.1 /100 | #285 | Tragic $41,737 |
| Mexican American Indians | 0.1 /100 | #286 | Tragic $41,719 |
| Indonesians | 0.1 /100 | #287 | Tragic $41,701 |
| Immigrants | Dominican Republic | 0.1 /100 | #288 | Tragic $41,554 |
| Comanche | 0.1 /100 | #289 | Tragic $41,519 |
| Paiute | 0.1 /100 | #290 | Tragic $41,508 |
Demographics Similar to Yuman by Median Earnings
In terms of median earnings, the demographic groups most similar to Yuman are Immigrants from Yemen ($39,540, a difference of 0.040%), Sioux ($39,448, a difference of 0.19%), Creek ($39,648, a difference of 0.32%), Ottawa ($39,721, a difference of 0.50%), and Bahamian ($39,735, a difference of 0.54%).
| Demographics | Rating | Rank | Median Earnings |
| Immigrants | Bahamas | 0.0 /100 | #320 | Tragic $39,861 |
| Mexicans | 0.0 /100 | #321 | Tragic $39,834 |
| Immigrants | Central America | 0.0 /100 | #322 | Tragic $39,762 |
| Bahamians | 0.0 /100 | #323 | Tragic $39,735 |
| Ottawa | 0.0 /100 | #324 | Tragic $39,721 |
| Creek | 0.0 /100 | #325 | Tragic $39,648 |
| Immigrants | Yemen | 0.0 /100 | #326 | Tragic $39,540 |
| Yuman | 0.0 /100 | #327 | Tragic $39,523 |
| Sioux | 0.0 /100 | #328 | Tragic $39,448 |
| Kiowa | 0.0 /100 | #329 | Tragic $39,232 |
| Immigrants | Congo | 0.0 /100 | #330 | Tragic $39,169 |
| Immigrants | Mexico | 0.0 /100 | #331 | Tragic $39,114 |
| Yakama | 0.0 /100 | #332 | Tragic $39,107 |
| Houma | 0.0 /100 | #333 | Tragic $38,949 |
| Spanish American Indians | 0.0 /100 | #334 | Tragic $38,907 |