Dominican vs Cheyenne Bachelor's Degree
COMPARE
Dominican
Cheyenne
Bachelor's Degree
Bachelor's Degree Comparison
Dominicans
Cheyenne
31.8%
BACHELOR'S DEGREE
0.1/ 100
METRIC RATING
277th/ 347
METRIC RANK
29.4%
BACHELOR'S DEGREE
0.0/ 100
METRIC RATING
310th/ 347
METRIC RANK
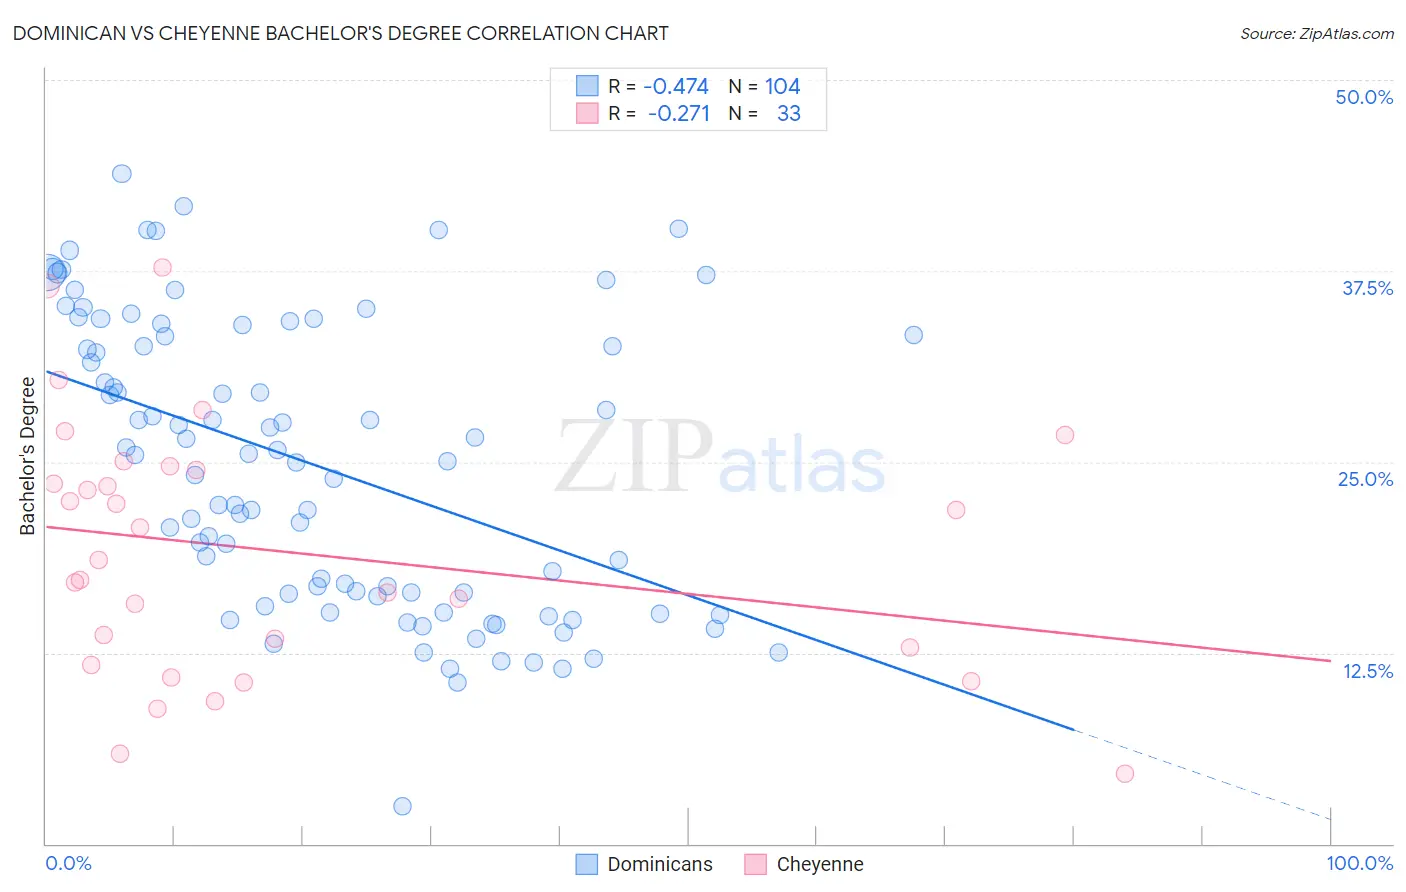
Dominican vs Cheyenne Bachelor's Degree Correlation Chart
The statistical analysis conducted on geographies consisting of 355,082,145 people shows a moderate negative correlation between the proportion of Dominicans and percentage of population with at least bachelor's degree education in the United States with a correlation coefficient (R) of -0.474 and weighted average of 31.8%. Similarly, the statistical analysis conducted on geographies consisting of 80,718,972 people shows a weak negative correlation between the proportion of Cheyenne and percentage of population with at least bachelor's degree education in the United States with a correlation coefficient (R) of -0.271 and weighted average of 29.4%, a difference of 7.8%.
Bachelor's Degree Correlation Summary
| Measurement | Dominican | Cheyenne |
| Minimum | 2.5% | 4.6% |
| Maximum | 43.9% | 37.7% |
| Range | 41.4% | 33.1% |
| Mean | 24.8% | 19.1% |
| Median | 25.2% | 18.6% |
| Interquartile 25% (IQ1) | 16.3% | 12.3% |
| Interquartile 75% (IQ3) | 33.3% | 24.6% |
| Interquartile Range (IQR) | 17.0% | 12.3% |
| Standard Deviation (Sample) | 9.4% | 8.2% |
| Standard Deviation (Population) | 9.3% | 8.1% |
Similar Demographics by Bachelor's Degree
Demographics Similar to Dominicans by Bachelor's Degree
In terms of bachelor's degree, the demographic groups most similar to Dominicans are Marshallese (31.7%, a difference of 0.050%), Salvadoran (31.8%, a difference of 0.15%), Samoan (31.8%, a difference of 0.19%), Potawatomi (31.9%, a difference of 0.32%), and American (31.9%, a difference of 0.34%).
| Demographics | Rating | Rank | Bachelor's Degree |
| Immigrants | Nicaragua | 0.2 /100 | #270 | Tragic 31.9% |
| Central Americans | 0.2 /100 | #271 | Tragic 31.9% |
| Comanche | 0.2 /100 | #272 | Tragic 31.9% |
| Americans | 0.2 /100 | #273 | Tragic 31.9% |
| Potawatomi | 0.2 /100 | #274 | Tragic 31.9% |
| Samoans | 0.1 /100 | #275 | Tragic 31.8% |
| Salvadorans | 0.1 /100 | #276 | Tragic 31.8% |
| Dominicans | 0.1 /100 | #277 | Tragic 31.8% |
| Marshallese | 0.1 /100 | #278 | Tragic 31.7% |
| Hawaiians | 0.1 /100 | #279 | Tragic 31.6% |
| Immigrants | Laos | 0.1 /100 | #280 | Tragic 31.6% |
| Blackfeet | 0.1 /100 | #281 | Tragic 31.5% |
| Immigrants | Caribbean | 0.1 /100 | #282 | Tragic 31.4% |
| Hondurans | 0.1 /100 | #283 | Tragic 31.3% |
| Haitians | 0.1 /100 | #284 | Tragic 31.3% |
Demographics Similar to Cheyenne by Bachelor's Degree
In terms of bachelor's degree, the demographic groups most similar to Cheyenne are Choctaw (29.4%, a difference of 0.070%), Seminole (29.4%, a difference of 0.13%), Alaska Native (29.4%, a difference of 0.31%), Hispanic or Latino (29.6%, a difference of 0.47%), and Shoshone (29.3%, a difference of 0.60%).
| Demographics | Rating | Rank | Bachelor's Degree |
| Bangladeshis | 0.0 /100 | #303 | Tragic 30.2% |
| Cherokee | 0.0 /100 | #304 | Tragic 30.2% |
| Immigrants | Latin America | 0.0 /100 | #305 | Tragic 30.1% |
| Immigrants | Yemen | 0.0 /100 | #306 | Tragic 29.9% |
| Nepalese | 0.0 /100 | #307 | Tragic 29.9% |
| Cajuns | 0.0 /100 | #308 | Tragic 29.6% |
| Hispanics or Latinos | 0.0 /100 | #309 | Tragic 29.6% |
| Cheyenne | 0.0 /100 | #310 | Tragic 29.4% |
| Choctaw | 0.0 /100 | #311 | Tragic 29.4% |
| Seminole | 0.0 /100 | #312 | Tragic 29.4% |
| Alaska Natives | 0.0 /100 | #313 | Tragic 29.4% |
| Shoshone | 0.0 /100 | #314 | Tragic 29.3% |
| Immigrants | Cabo Verde | 0.0 /100 | #315 | Tragic 29.2% |
| Sioux | 0.0 /100 | #316 | Tragic 29.1% |
| Colville | 0.0 /100 | #317 | Tragic 29.0% |