Immigrants from Cameroon vs Cheyenne Median Earnings
COMPARE
Immigrants from Cameroon
Cheyenne
Median Earnings
Median Earnings Comparison
Immigrants from Cameroon
Cheyenne
$46,329
MEDIAN EARNINGS
46.4/ 100
METRIC RATING
181st/ 347
METRIC RANK
$40,233
MEDIAN EARNINGS
0.0/ 100
METRIC RATING
314th/ 347
METRIC RANK
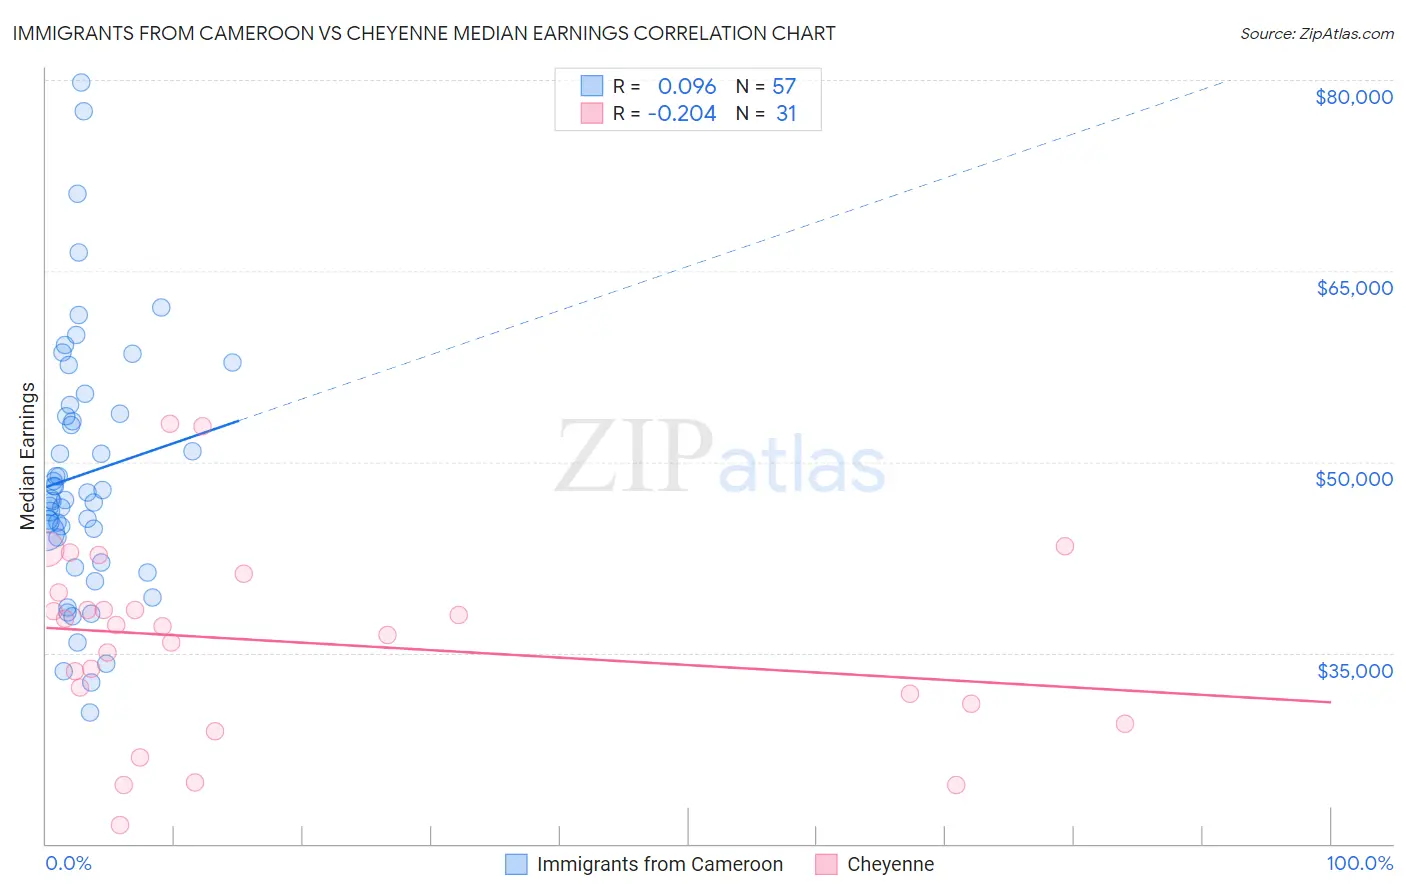
Immigrants from Cameroon vs Cheyenne Median Earnings Correlation Chart
The statistical analysis conducted on geographies consisting of 130,751,412 people shows a slight positive correlation between the proportion of Immigrants from Cameroon and median earnings in the United States with a correlation coefficient (R) of 0.096 and weighted average of $46,329. Similarly, the statistical analysis conducted on geographies consisting of 80,717,230 people shows a weak negative correlation between the proportion of Cheyenne and median earnings in the United States with a correlation coefficient (R) of -0.204 and weighted average of $40,233, a difference of 15.1%.
Median Earnings Correlation Summary
| Measurement | Immigrants from Cameroon | Cheyenne |
| Minimum | $30,304 | $21,433 |
| Maximum | $79,786 | $52,964 |
| Range | $49,482 | $31,531 |
| Mean | $49,022 | $35,877 |
| Median | $47,064 | $37,115 |
| Interquartile 25% (IQ1) | $43,064 | $31,011 |
| Interquartile 75% (IQ3) | $54,101 | $39,717 |
| Interquartile Range (IQR) | $11,037 | $8,706 |
| Standard Deviation (Sample) | $10,190 | $7,496 |
| Standard Deviation (Population) | $10,100 | $7,374 |
Similar Demographics by Median Earnings
Demographics Similar to Immigrants from Cameroon by Median Earnings
In terms of median earnings, the demographic groups most similar to Immigrants from Cameroon are English ($46,334, a difference of 0.010%), Puget Sound Salish ($46,333, a difference of 0.010%), Swiss ($46,315, a difference of 0.030%), Colombian ($46,349, a difference of 0.040%), and French ($46,296, a difference of 0.070%).
| Demographics | Rating | Rank | Median Earnings |
| Scandinavians | 50.0 /100 | #174 | Average $46,433 |
| Basques | 48.8 /100 | #175 | Average $46,399 |
| Danes | 48.6 /100 | #176 | Average $46,392 |
| Belgians | 48.0 /100 | #177 | Average $46,375 |
| Colombians | 47.1 /100 | #178 | Average $46,349 |
| English | 46.5 /100 | #179 | Average $46,334 |
| Puget Sound Salish | 46.5 /100 | #180 | Average $46,333 |
| Immigrants | Cameroon | 46.4 /100 | #181 | Average $46,329 |
| Swiss | 45.9 /100 | #182 | Average $46,315 |
| French | 45.2 /100 | #183 | Average $46,296 |
| Immigrants | Kenya | 42.4 /100 | #184 | Average $46,214 |
| Uruguayans | 41.6 /100 | #185 | Average $46,190 |
| Vietnamese | 40.9 /100 | #186 | Average $46,172 |
| Iraqis | 39.9 /100 | #187 | Fair $46,140 |
| Immigrants | Armenia | 38.3 /100 | #188 | Fair $46,094 |
Demographics Similar to Cheyenne by Median Earnings
In terms of median earnings, the demographic groups most similar to Cheyenne are Seminole ($40,233, a difference of 0.0%), Choctaw ($40,270, a difference of 0.090%), Immigrants from Honduras ($40,195, a difference of 0.10%), Fijian ($40,193, a difference of 0.10%), and Chippewa ($40,287, a difference of 0.13%).
| Demographics | Rating | Rank | Median Earnings |
| Hondurans | 0.0 /100 | #307 | Tragic $40,638 |
| Cubans | 0.0 /100 | #308 | Tragic $40,619 |
| Immigrants | Haiti | 0.0 /100 | #309 | Tragic $40,550 |
| Apache | 0.0 /100 | #310 | Tragic $40,388 |
| Hispanics or Latinos | 0.0 /100 | #311 | Tragic $40,288 |
| Chippewa | 0.0 /100 | #312 | Tragic $40,287 |
| Choctaw | 0.0 /100 | #313 | Tragic $40,270 |
| Cheyenne | 0.0 /100 | #314 | Tragic $40,233 |
| Seminole | 0.0 /100 | #315 | Tragic $40,233 |
| Immigrants | Honduras | 0.0 /100 | #316 | Tragic $40,195 |
| Fijians | 0.0 /100 | #317 | Tragic $40,193 |
| Dutch West Indians | 0.0 /100 | #318 | Tragic $40,107 |
| Blacks/African Americans | 0.0 /100 | #319 | Tragic $40,085 |
| Immigrants | Bahamas | 0.0 /100 | #320 | Tragic $39,861 |
| Mexicans | 0.0 /100 | #321 | Tragic $39,834 |