Dominican vs South American Median Earnings
COMPARE
Dominican
South American
Median Earnings
Median Earnings Comparison
Dominicans
South Americans
$41,864
MEDIAN EARNINGS
0.2/ 100
METRIC RATING
283rd/ 347
METRIC RANK
$46,804
MEDIAN EARNINGS
62.7/ 100
METRIC RATING
165th/ 347
METRIC RANK
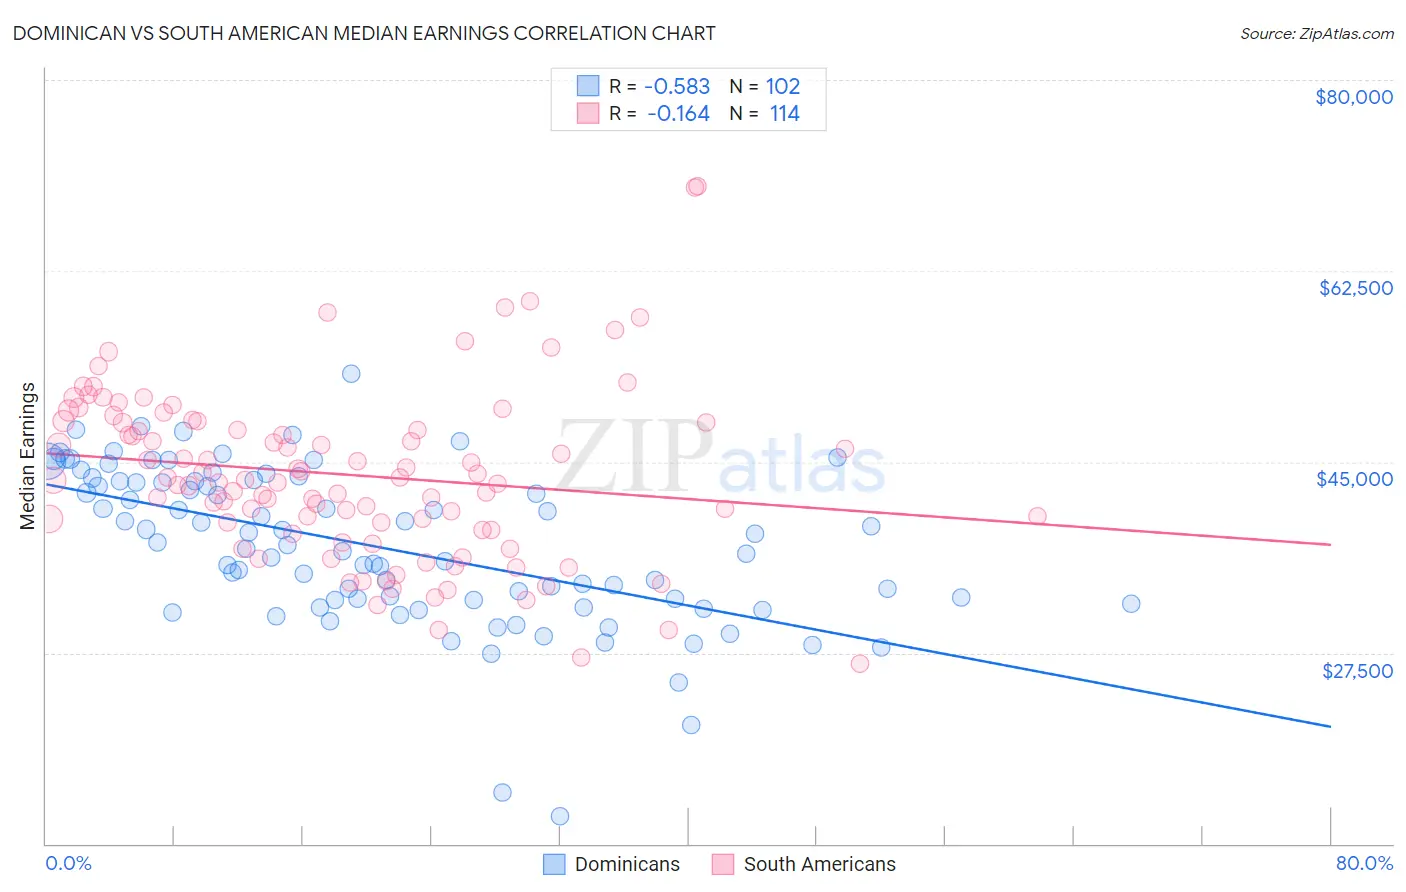
Dominican vs South American Median Earnings Correlation Chart
The statistical analysis conducted on geographies consisting of 355,132,428 people shows a substantial negative correlation between the proportion of Dominicans and median earnings in the United States with a correlation coefficient (R) of -0.583 and weighted average of $41,864. Similarly, the statistical analysis conducted on geographies consisting of 494,103,874 people shows a poor negative correlation between the proportion of South Americans and median earnings in the United States with a correlation coefficient (R) of -0.164 and weighted average of $46,804, a difference of 11.8%.
Median Earnings Correlation Summary
| Measurement | Dominican | South American |
| Minimum | $12,552 | $26,500 |
| Maximum | $53,134 | $70,221 |
| Range | $40,582 | $43,721 |
| Mean | $37,192 | $43,826 |
| Median | $37,213 | $43,308 |
| Interquartile 25% (IQ1) | $32,338 | $38,802 |
| Interquartile 75% (IQ3) | $43,235 | $48,652 |
| Interquartile Range (IQR) | $10,898 | $9,850 |
| Standard Deviation (Sample) | $7,182 | $7,886 |
| Standard Deviation (Population) | $7,146 | $7,851 |
Similar Demographics by Median Earnings
Demographics Similar to Dominicans by Median Earnings
In terms of median earnings, the demographic groups most similar to Dominicans are Blackfeet ($41,822, a difference of 0.10%), African ($41,955, a difference of 0.22%), Marshallese ($41,969, a difference of 0.25%), Immigrants from Nicaragua ($41,737, a difference of 0.31%), and Mexican American Indian ($41,719, a difference of 0.35%).
| Demographics | Rating | Rank | Median Earnings |
| Spanish Americans | 0.3 /100 | #276 | Tragic $42,316 |
| Central Americans | 0.3 /100 | #277 | Tragic $42,280 |
| Cajuns | 0.3 /100 | #278 | Tragic $42,189 |
| Colville | 0.2 /100 | #279 | Tragic $42,151 |
| Hmong | 0.2 /100 | #280 | Tragic $42,111 |
| Marshallese | 0.2 /100 | #281 | Tragic $41,969 |
| Africans | 0.2 /100 | #282 | Tragic $41,955 |
| Dominicans | 0.2 /100 | #283 | Tragic $41,864 |
| Blackfeet | 0.2 /100 | #284 | Tragic $41,822 |
| Immigrants | Nicaragua | 0.1 /100 | #285 | Tragic $41,737 |
| Mexican American Indians | 0.1 /100 | #286 | Tragic $41,719 |
| Indonesians | 0.1 /100 | #287 | Tragic $41,701 |
| Immigrants | Dominican Republic | 0.1 /100 | #288 | Tragic $41,554 |
| Comanche | 0.1 /100 | #289 | Tragic $41,519 |
| Paiute | 0.1 /100 | #290 | Tragic $41,508 |
Demographics Similar to South Americans by Median Earnings
In terms of median earnings, the demographic groups most similar to South Americans are Norwegian ($46,865, a difference of 0.13%), Icelander ($46,916, a difference of 0.24%), Czechoslovakian ($46,658, a difference of 0.31%), South American Indian ($46,952, a difference of 0.32%), and Costa Rican ($46,645, a difference of 0.34%).
| Demographics | Rating | Rank | Median Earnings |
| Slovaks | 71.7 /100 | #158 | Good $47,095 |
| Immigrants | Peru | 69.6 /100 | #159 | Good $47,025 |
| Alsatians | 69.6 /100 | #160 | Good $47,023 |
| Immigrants | Eastern Africa | 68.0 /100 | #161 | Good $46,969 |
| South American Indians | 67.4 /100 | #162 | Good $46,952 |
| Icelanders | 66.3 /100 | #163 | Good $46,916 |
| Norwegians | 64.7 /100 | #164 | Good $46,865 |
| South Americans | 62.7 /100 | #165 | Good $46,804 |
| Czechoslovakians | 57.8 /100 | #166 | Average $46,658 |
| Costa Ricans | 57.4 /100 | #167 | Average $46,645 |
| Immigrants | Africa | 54.6 /100 | #168 | Average $46,564 |
| Immigrants | South America | 54.0 /100 | #169 | Average $46,548 |
| Immigrants | Immigrants | 51.6 /100 | #170 | Average $46,478 |
| Scottish | 51.1 /100 | #171 | Average $46,463 |
| Kenyans | 51.0 /100 | #172 | Average $46,462 |