Dominican vs Immigrants from China Median Earnings
COMPARE
Dominican
Immigrants from China
Median Earnings
Median Earnings Comparison
Dominicans
Immigrants from China
$41,864
MEDIAN EARNINGS
0.2/ 100
METRIC RATING
283rd/ 347
METRIC RANK
$56,638
MEDIAN EARNINGS
100.0/ 100
METRIC RATING
13th/ 347
METRIC RANK
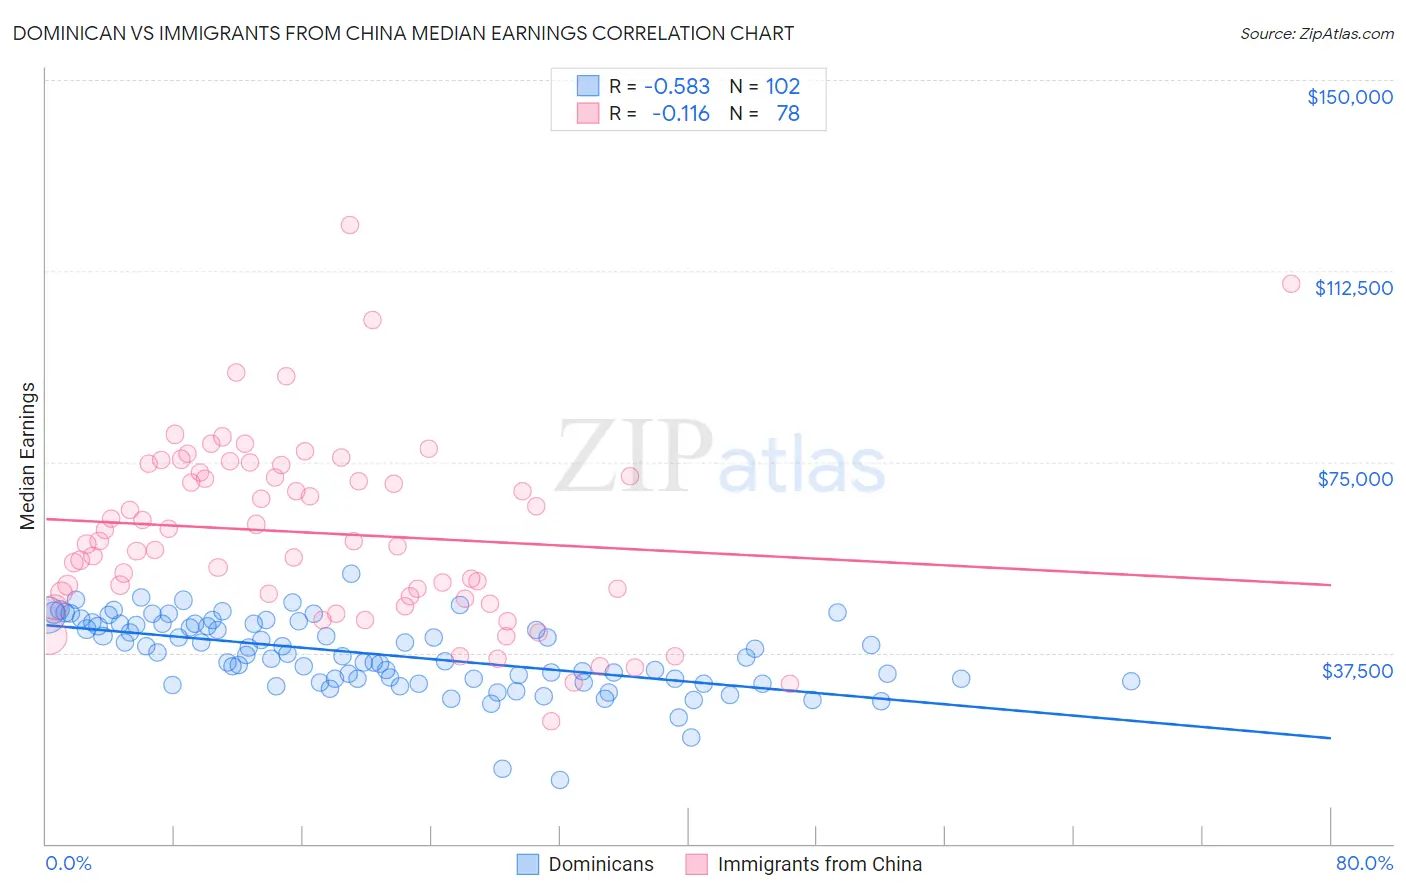
Dominican vs Immigrants from China Median Earnings Correlation Chart
The statistical analysis conducted on geographies consisting of 355,132,428 people shows a substantial negative correlation between the proportion of Dominicans and median earnings in the United States with a correlation coefficient (R) of -0.583 and weighted average of $41,864. Similarly, the statistical analysis conducted on geographies consisting of 457,063,643 people shows a poor negative correlation between the proportion of Immigrants from China and median earnings in the United States with a correlation coefficient (R) of -0.116 and weighted average of $56,638, a difference of 35.3%.
Median Earnings Correlation Summary
| Measurement | Dominican | Immigrants from China |
| Minimum | $12,552 | $23,942 |
| Maximum | $53,134 | $121,459 |
| Range | $40,582 | $97,517 |
| Mean | $37,192 | $60,963 |
| Median | $37,213 | $59,099 |
| Interquartile 25% (IQ1) | $32,338 | $48,648 |
| Interquartile 75% (IQ3) | $43,235 | $73,028 |
| Interquartile Range (IQR) | $10,898 | $24,380 |
| Standard Deviation (Sample) | $7,182 | $18,079 |
| Standard Deviation (Population) | $7,146 | $17,962 |
Similar Demographics by Median Earnings
Demographics Similar to Dominicans by Median Earnings
In terms of median earnings, the demographic groups most similar to Dominicans are Blackfeet ($41,822, a difference of 0.10%), African ($41,955, a difference of 0.22%), Marshallese ($41,969, a difference of 0.25%), Immigrants from Nicaragua ($41,737, a difference of 0.31%), and Mexican American Indian ($41,719, a difference of 0.35%).
| Demographics | Rating | Rank | Median Earnings |
| Spanish Americans | 0.3 /100 | #276 | Tragic $42,316 |
| Central Americans | 0.3 /100 | #277 | Tragic $42,280 |
| Cajuns | 0.3 /100 | #278 | Tragic $42,189 |
| Colville | 0.2 /100 | #279 | Tragic $42,151 |
| Hmong | 0.2 /100 | #280 | Tragic $42,111 |
| Marshallese | 0.2 /100 | #281 | Tragic $41,969 |
| Africans | 0.2 /100 | #282 | Tragic $41,955 |
| Dominicans | 0.2 /100 | #283 | Tragic $41,864 |
| Blackfeet | 0.2 /100 | #284 | Tragic $41,822 |
| Immigrants | Nicaragua | 0.1 /100 | #285 | Tragic $41,737 |
| Mexican American Indians | 0.1 /100 | #286 | Tragic $41,719 |
| Indonesians | 0.1 /100 | #287 | Tragic $41,701 |
| Immigrants | Dominican Republic | 0.1 /100 | #288 | Tragic $41,554 |
| Comanche | 0.1 /100 | #289 | Tragic $41,519 |
| Paiute | 0.1 /100 | #290 | Tragic $41,508 |
Demographics Similar to Immigrants from China by Median Earnings
In terms of median earnings, the demographic groups most similar to Immigrants from China are Immigrants from Ireland ($56,854, a difference of 0.38%), Immigrants from Australia ($56,305, a difference of 0.59%), Indian (Asian) ($56,253, a difference of 0.68%), Immigrants from Israel ($57,034, a difference of 0.70%), and Immigrants from Eastern Asia ($56,183, a difference of 0.81%).
| Demographics | Rating | Rank | Median Earnings |
| Immigrants | Singapore | 100.0 /100 | #6 | Exceptional $59,038 |
| Iranians | 100.0 /100 | #7 | Exceptional $58,474 |
| Immigrants | Iran | 100.0 /100 | #8 | Exceptional $57,612 |
| Okinawans | 100.0 /100 | #9 | Exceptional $57,550 |
| Immigrants | South Central Asia | 100.0 /100 | #10 | Exceptional $57,114 |
| Immigrants | Israel | 100.0 /100 | #11 | Exceptional $57,034 |
| Immigrants | Ireland | 100.0 /100 | #12 | Exceptional $56,854 |
| Immigrants | China | 100.0 /100 | #13 | Exceptional $56,638 |
| Immigrants | Australia | 100.0 /100 | #14 | Exceptional $56,305 |
| Indians (Asian) | 100.0 /100 | #15 | Exceptional $56,253 |
| Immigrants | Eastern Asia | 100.0 /100 | #16 | Exceptional $56,183 |
| Eastern Europeans | 100.0 /100 | #17 | Exceptional $55,084 |
| Immigrants | Japan | 100.0 /100 | #18 | Exceptional $54,938 |
| Immigrants | Belgium | 100.0 /100 | #19 | Exceptional $54,679 |
| Cypriots | 100.0 /100 | #20 | Exceptional $54,589 |