Immigrants from Eastern Africa vs Cheyenne Median Earnings
COMPARE
Immigrants from Eastern Africa
Cheyenne
Median Earnings
Median Earnings Comparison
Immigrants from Eastern Africa
Cheyenne
$46,969
MEDIAN EARNINGS
68.0/ 100
METRIC RATING
161st/ 347
METRIC RANK
$40,233
MEDIAN EARNINGS
0.0/ 100
METRIC RATING
314th/ 347
METRIC RANK
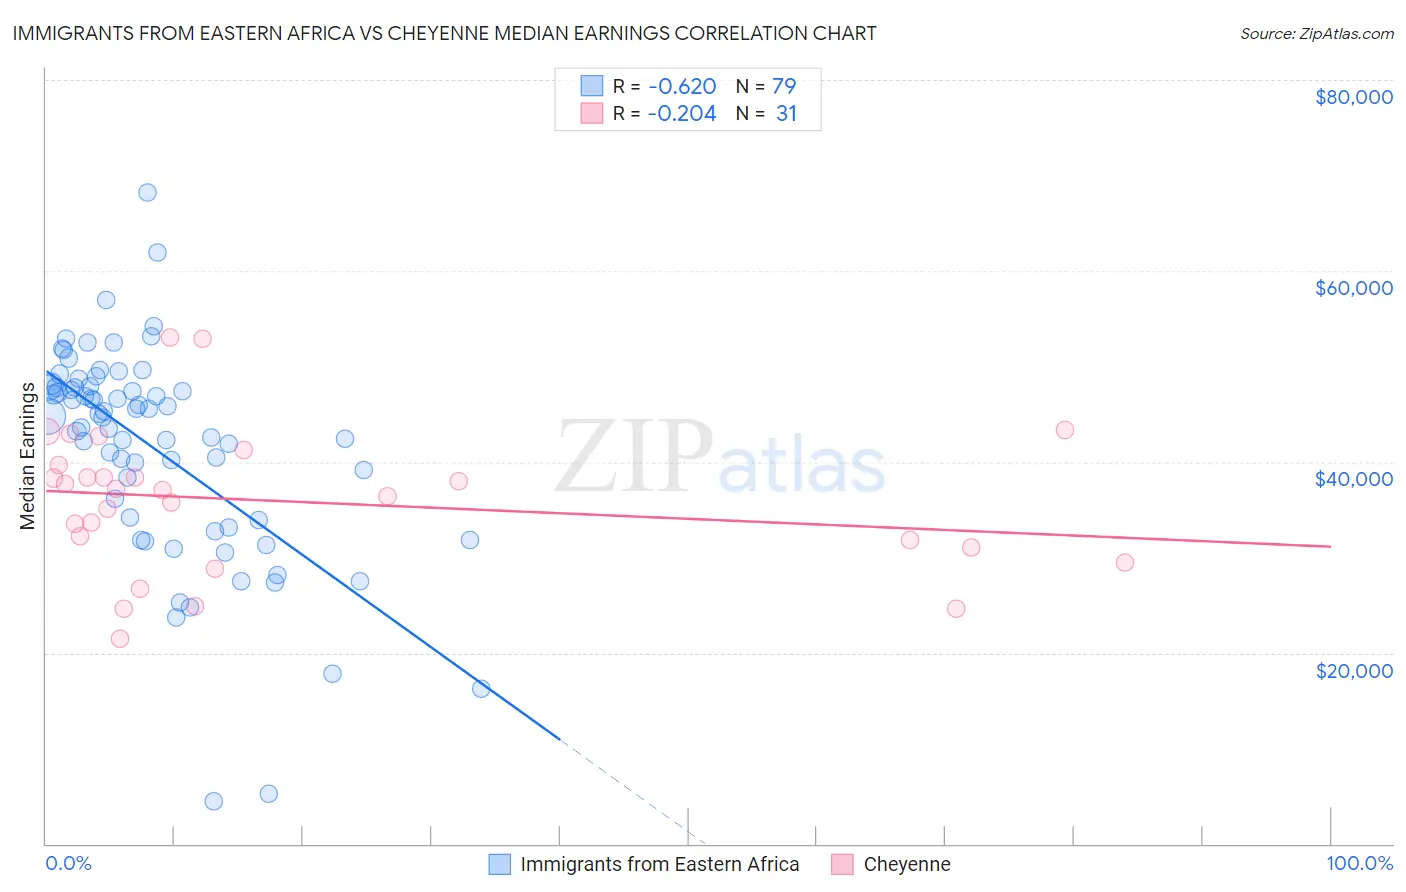
Immigrants from Eastern Africa vs Cheyenne Median Earnings Correlation Chart
The statistical analysis conducted on geographies consisting of 355,152,385 people shows a significant negative correlation between the proportion of Immigrants from Eastern Africa and median earnings in the United States with a correlation coefficient (R) of -0.620 and weighted average of $46,969. Similarly, the statistical analysis conducted on geographies consisting of 80,717,230 people shows a weak negative correlation between the proportion of Cheyenne and median earnings in the United States with a correlation coefficient (R) of -0.204 and weighted average of $40,233, a difference of 16.7%.
Median Earnings Correlation Summary
| Measurement | Immigrants from Eastern Africa | Cheyenne |
| Minimum | $4,426 | $21,433 |
| Maximum | $68,236 | $52,964 |
| Range | $63,810 | $31,531 |
| Mean | $41,397 | $35,877 |
| Median | $44,805 | $37,115 |
| Interquartile 25% (IQ1) | $33,958 | $31,011 |
| Interquartile 75% (IQ3) | $47,783 | $39,717 |
| Interquartile Range (IQR) | $13,825 | $8,706 |
| Standard Deviation (Sample) | $11,219 | $7,496 |
| Standard Deviation (Population) | $11,147 | $7,374 |
Similar Demographics by Median Earnings
Demographics Similar to Immigrants from Eastern Africa by Median Earnings
In terms of median earnings, the demographic groups most similar to Immigrants from Eastern Africa are South American Indian ($46,952, a difference of 0.040%), Alsatian ($47,023, a difference of 0.11%), Icelander ($46,916, a difference of 0.11%), Immigrants from Peru ($47,025, a difference of 0.12%), and Norwegian ($46,865, a difference of 0.22%).
| Demographics | Rating | Rank | Median Earnings |
| Immigrants | Portugal | 77.3 /100 | #154 | Good $47,304 |
| Immigrants | Vietnam | 76.7 /100 | #155 | Good $47,282 |
| Irish | 76.6 /100 | #156 | Good $47,276 |
| Czechs | 75.1 /100 | #157 | Good $47,221 |
| Slovaks | 71.7 /100 | #158 | Good $47,095 |
| Immigrants | Peru | 69.6 /100 | #159 | Good $47,025 |
| Alsatians | 69.6 /100 | #160 | Good $47,023 |
| Immigrants | Eastern Africa | 68.0 /100 | #161 | Good $46,969 |
| South American Indians | 67.4 /100 | #162 | Good $46,952 |
| Icelanders | 66.3 /100 | #163 | Good $46,916 |
| Norwegians | 64.7 /100 | #164 | Good $46,865 |
| South Americans | 62.7 /100 | #165 | Good $46,804 |
| Czechoslovakians | 57.8 /100 | #166 | Average $46,658 |
| Costa Ricans | 57.4 /100 | #167 | Average $46,645 |
| Immigrants | Africa | 54.6 /100 | #168 | Average $46,564 |
Demographics Similar to Cheyenne by Median Earnings
In terms of median earnings, the demographic groups most similar to Cheyenne are Seminole ($40,233, a difference of 0.0%), Choctaw ($40,270, a difference of 0.090%), Immigrants from Honduras ($40,195, a difference of 0.10%), Fijian ($40,193, a difference of 0.10%), and Chippewa ($40,287, a difference of 0.13%).
| Demographics | Rating | Rank | Median Earnings |
| Hondurans | 0.0 /100 | #307 | Tragic $40,638 |
| Cubans | 0.0 /100 | #308 | Tragic $40,619 |
| Immigrants | Haiti | 0.0 /100 | #309 | Tragic $40,550 |
| Apache | 0.0 /100 | #310 | Tragic $40,388 |
| Hispanics or Latinos | 0.0 /100 | #311 | Tragic $40,288 |
| Chippewa | 0.0 /100 | #312 | Tragic $40,287 |
| Choctaw | 0.0 /100 | #313 | Tragic $40,270 |
| Cheyenne | 0.0 /100 | #314 | Tragic $40,233 |
| Seminole | 0.0 /100 | #315 | Tragic $40,233 |
| Immigrants | Honduras | 0.0 /100 | #316 | Tragic $40,195 |
| Fijians | 0.0 /100 | #317 | Tragic $40,193 |
| Dutch West Indians | 0.0 /100 | #318 | Tragic $40,107 |
| Blacks/African Americans | 0.0 /100 | #319 | Tragic $40,085 |
| Immigrants | Bahamas | 0.0 /100 | #320 | Tragic $39,861 |
| Mexicans | 0.0 /100 | #321 | Tragic $39,834 |