Potawatomi vs Ottawa Per Capita Income
COMPARE
Potawatomi
Ottawa
Per Capita Income
Per Capita Income Comparison
Potawatomi
Ottawa
$38,046
PER CAPITA INCOME
0.2/ 100
METRIC RATING
280th/ 347
METRIC RANK
$37,101
PER CAPITA INCOME
0.1/ 100
METRIC RATING
301st/ 347
METRIC RANK
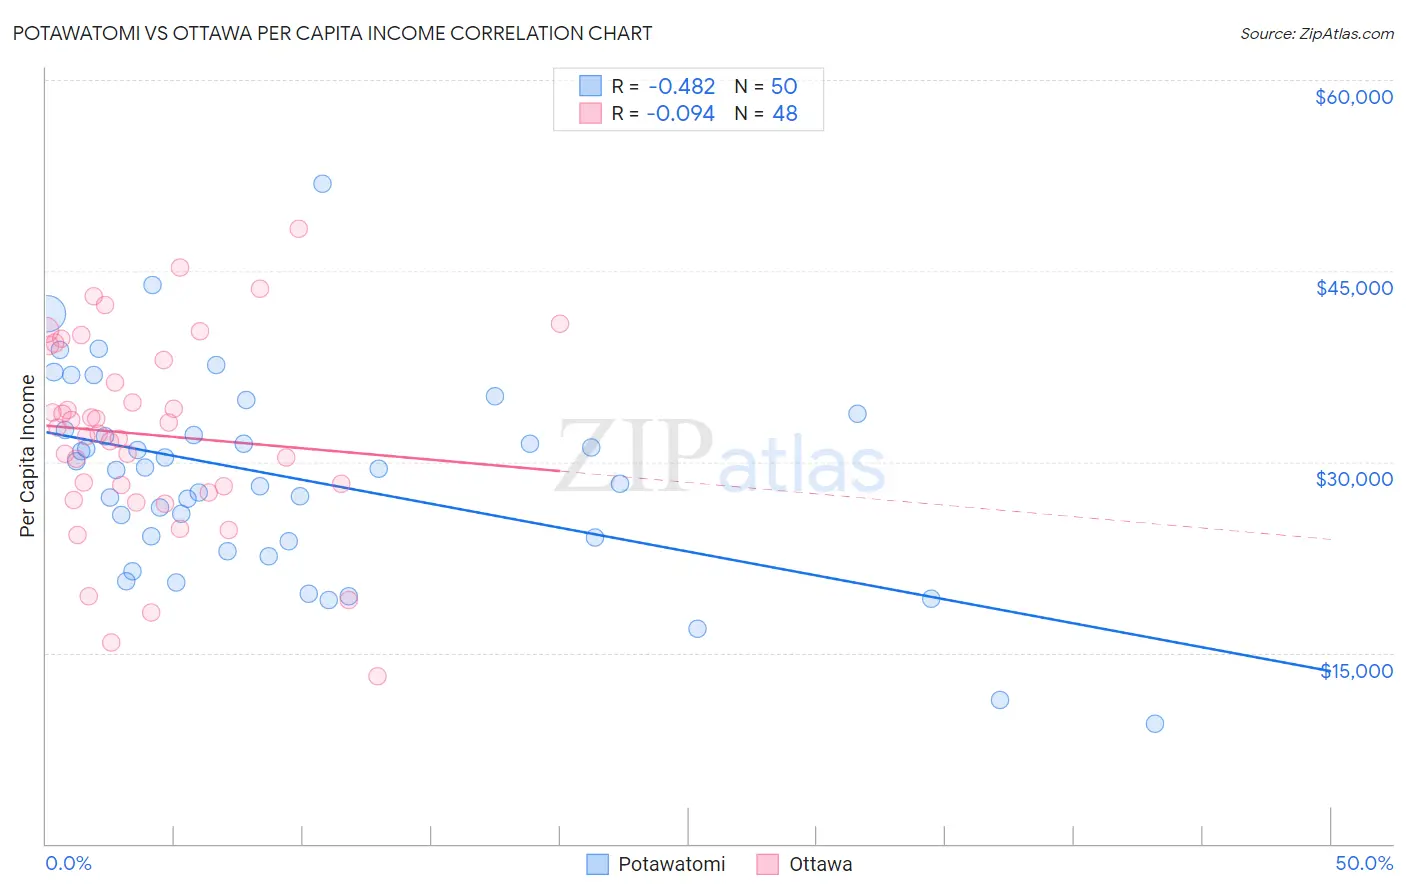
Potawatomi vs Ottawa Per Capita Income Correlation Chart
The statistical analysis conducted on geographies consisting of 117,768,459 people shows a moderate negative correlation between the proportion of Potawatomi and per capita income in the United States with a correlation coefficient (R) of -0.482 and weighted average of $38,046. Similarly, the statistical analysis conducted on geographies consisting of 49,956,726 people shows a slight negative correlation between the proportion of Ottawa and per capita income in the United States with a correlation coefficient (R) of -0.094 and weighted average of $37,101, a difference of 2.5%.
Per Capita Income Correlation Summary
| Measurement | Potawatomi | Ottawa |
| Minimum | $9,447 | $13,161 |
| Maximum | $51,870 | $48,274 |
| Range | $42,423 | $35,113 |
| Mean | $28,766 | $32,137 |
| Median | $29,420 | $32,448 |
| Interquartile 25% (IQ1) | $23,768 | $27,814 |
| Interquartile 75% (IQ3) | $32,549 | $38,554 |
| Interquartile Range (IQR) | $8,781 | $10,740 |
| Standard Deviation (Sample) | $7,980 | $7,713 |
| Standard Deviation (Population) | $7,900 | $7,632 |
Similar Demographics by Per Capita Income
Demographics Similar to Potawatomi by Per Capita Income
In terms of per capita income, the demographic groups most similar to Potawatomi are Colville ($38,047, a difference of 0.0%), Immigrants from Nicaragua ($38,065, a difference of 0.050%), Comanche ($38,088, a difference of 0.11%), Hmong ($38,120, a difference of 0.20%), and Immigrants from Dominica ($37,952, a difference of 0.25%).
| Demographics | Rating | Rank | Per Capita Income |
| Nepalese | 0.3 /100 | #273 | Tragic $38,442 |
| Immigrants | El Salvador | 0.3 /100 | #274 | Tragic $38,394 |
| Immigrants | Liberia | 0.2 /100 | #275 | Tragic $38,165 |
| Hmong | 0.2 /100 | #276 | Tragic $38,120 |
| Comanche | 0.2 /100 | #277 | Tragic $38,088 |
| Immigrants | Nicaragua | 0.2 /100 | #278 | Tragic $38,065 |
| Colville | 0.2 /100 | #279 | Tragic $38,047 |
| Potawatomi | 0.2 /100 | #280 | Tragic $38,046 |
| Immigrants | Dominica | 0.2 /100 | #281 | Tragic $37,952 |
| Immigrants | Laos | 0.1 /100 | #282 | Tragic $37,857 |
| Pennsylvania Germans | 0.1 /100 | #283 | Tragic $37,842 |
| Africans | 0.1 /100 | #284 | Tragic $37,785 |
| Guatemalans | 0.1 /100 | #285 | Tragic $37,766 |
| Central American Indians | 0.1 /100 | #286 | Tragic $37,699 |
| Dominicans | 0.1 /100 | #287 | Tragic $37,697 |
Demographics Similar to Ottawa by Per Capita Income
In terms of per capita income, the demographic groups most similar to Ottawa are Shoshone ($37,072, a difference of 0.080%), Paiute ($37,066, a difference of 0.10%), Honduran ($37,031, a difference of 0.19%), Immigrants from Bahamas ($37,193, a difference of 0.25%), and Cherokee ($37,203, a difference of 0.27%).
| Demographics | Rating | Rank | Per Capita Income |
| Cubans | 0.1 /100 | #294 | Tragic $37,383 |
| Immigrants | Dominican Republic | 0.1 /100 | #295 | Tragic $37,306 |
| Indonesians | 0.1 /100 | #296 | Tragic $37,300 |
| Haitians | 0.1 /100 | #297 | Tragic $37,289 |
| Immigrants | Caribbean | 0.1 /100 | #298 | Tragic $37,254 |
| Cherokee | 0.1 /100 | #299 | Tragic $37,203 |
| Immigrants | Bahamas | 0.1 /100 | #300 | Tragic $37,193 |
| Ottawa | 0.1 /100 | #301 | Tragic $37,101 |
| Shoshone | 0.1 /100 | #302 | Tragic $37,072 |
| Paiute | 0.1 /100 | #303 | Tragic $37,066 |
| Hondurans | 0.1 /100 | #304 | Tragic $37,031 |
| Inupiat | 0.1 /100 | #305 | Tragic $36,999 |
| Immigrants | Haiti | 0.0 /100 | #306 | Tragic $36,849 |
| Immigrants | Latin America | 0.0 /100 | #307 | Tragic $36,823 |
| Fijians | 0.0 /100 | #308 | Tragic $36,690 |