Mexican American Indian vs Ottawa Per Capita Income
COMPARE
Mexican American Indian
Ottawa
Per Capita Income
Per Capita Income Comparison
Mexican American Indians
Ottawa
$37,407
PER CAPITA INCOME
0.1/ 100
METRIC RATING
293rd/ 347
METRIC RANK
$37,101
PER CAPITA INCOME
0.1/ 100
METRIC RATING
301st/ 347
METRIC RANK
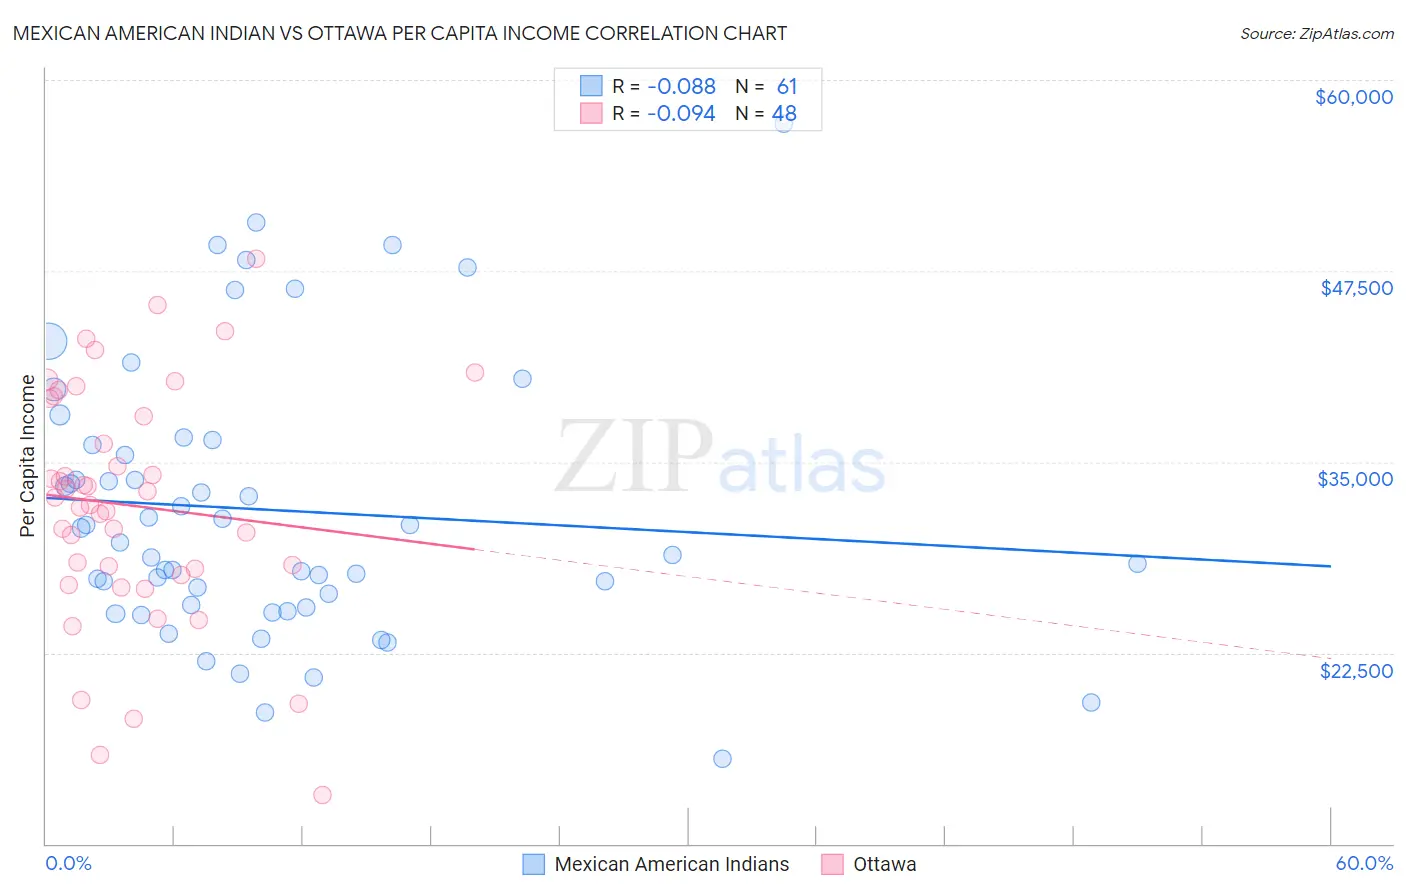
Mexican American Indian vs Ottawa Per Capita Income Correlation Chart
The statistical analysis conducted on geographies consisting of 317,620,021 people shows a slight negative correlation between the proportion of Mexican American Indians and per capita income in the United States with a correlation coefficient (R) of -0.088 and weighted average of $37,407. Similarly, the statistical analysis conducted on geographies consisting of 49,956,726 people shows a slight negative correlation between the proportion of Ottawa and per capita income in the United States with a correlation coefficient (R) of -0.094 and weighted average of $37,101, a difference of 0.82%.
Per Capita Income Correlation Summary
| Measurement | Mexican American Indian | Ottawa |
| Minimum | $15,543 | $13,161 |
| Maximum | $57,099 | $48,274 |
| Range | $41,556 | $35,113 |
| Mean | $31,846 | $32,137 |
| Median | $29,756 | $32,448 |
| Interquartile 25% (IQ1) | $25,545 | $27,814 |
| Interquartile 75% (IQ3) | $36,256 | $38,554 |
| Interquartile Range (IQR) | $10,711 | $10,740 |
| Standard Deviation (Sample) | $8,902 | $7,713 |
| Standard Deviation (Population) | $8,828 | $7,632 |
Demographics Similar to Mexican American Indians and Ottawa by Per Capita Income
In terms of per capita income, the demographic groups most similar to Mexican American Indians are Cuban ($37,383, a difference of 0.070%), Immigrants from Micronesia ($37,464, a difference of 0.15%), Immigrants from Dominican Republic ($37,306, a difference of 0.27%), Indonesian ($37,300, a difference of 0.29%), and Cajun ($37,527, a difference of 0.32%). Similarly, the demographic groups most similar to Ottawa are Shoshone ($37,072, a difference of 0.080%), Paiute ($37,066, a difference of 0.10%), Honduran ($37,031, a difference of 0.19%), Immigrants from Bahamas ($37,193, a difference of 0.25%), and Cherokee ($37,203, a difference of 0.27%).
| Demographics | Rating | Rank | Per Capita Income |
| Dominicans | 0.1 /100 | #287 | Tragic $37,697 |
| Blackfeet | 0.1 /100 | #288 | Tragic $37,695 |
| U.S. Virgin Islanders | 0.1 /100 | #289 | Tragic $37,589 |
| Immigrants | Guatemala | 0.1 /100 | #290 | Tragic $37,550 |
| Cajuns | 0.1 /100 | #291 | Tragic $37,527 |
| Immigrants | Micronesia | 0.1 /100 | #292 | Tragic $37,464 |
| Mexican American Indians | 0.1 /100 | #293 | Tragic $37,407 |
| Cubans | 0.1 /100 | #294 | Tragic $37,383 |
| Immigrants | Dominican Republic | 0.1 /100 | #295 | Tragic $37,306 |
| Indonesians | 0.1 /100 | #296 | Tragic $37,300 |
| Haitians | 0.1 /100 | #297 | Tragic $37,289 |
| Immigrants | Caribbean | 0.1 /100 | #298 | Tragic $37,254 |
| Cherokee | 0.1 /100 | #299 | Tragic $37,203 |
| Immigrants | Bahamas | 0.1 /100 | #300 | Tragic $37,193 |
| Ottawa | 0.1 /100 | #301 | Tragic $37,101 |
| Shoshone | 0.1 /100 | #302 | Tragic $37,072 |
| Paiute | 0.1 /100 | #303 | Tragic $37,066 |
| Hondurans | 0.1 /100 | #304 | Tragic $37,031 |
| Inupiat | 0.1 /100 | #305 | Tragic $36,999 |
| Immigrants | Haiti | 0.0 /100 | #306 | Tragic $36,849 |
| Immigrants | Latin America | 0.0 /100 | #307 | Tragic $36,823 |