Jamaican vs Ottawa Per Capita Income
COMPARE
Jamaican
Ottawa
Per Capita Income
Per Capita Income Comparison
Jamaicans
Ottawa
$39,231
PER CAPITA INCOME
0.7/ 100
METRIC RATING
258th/ 347
METRIC RANK
$37,101
PER CAPITA INCOME
0.1/ 100
METRIC RATING
301st/ 347
METRIC RANK
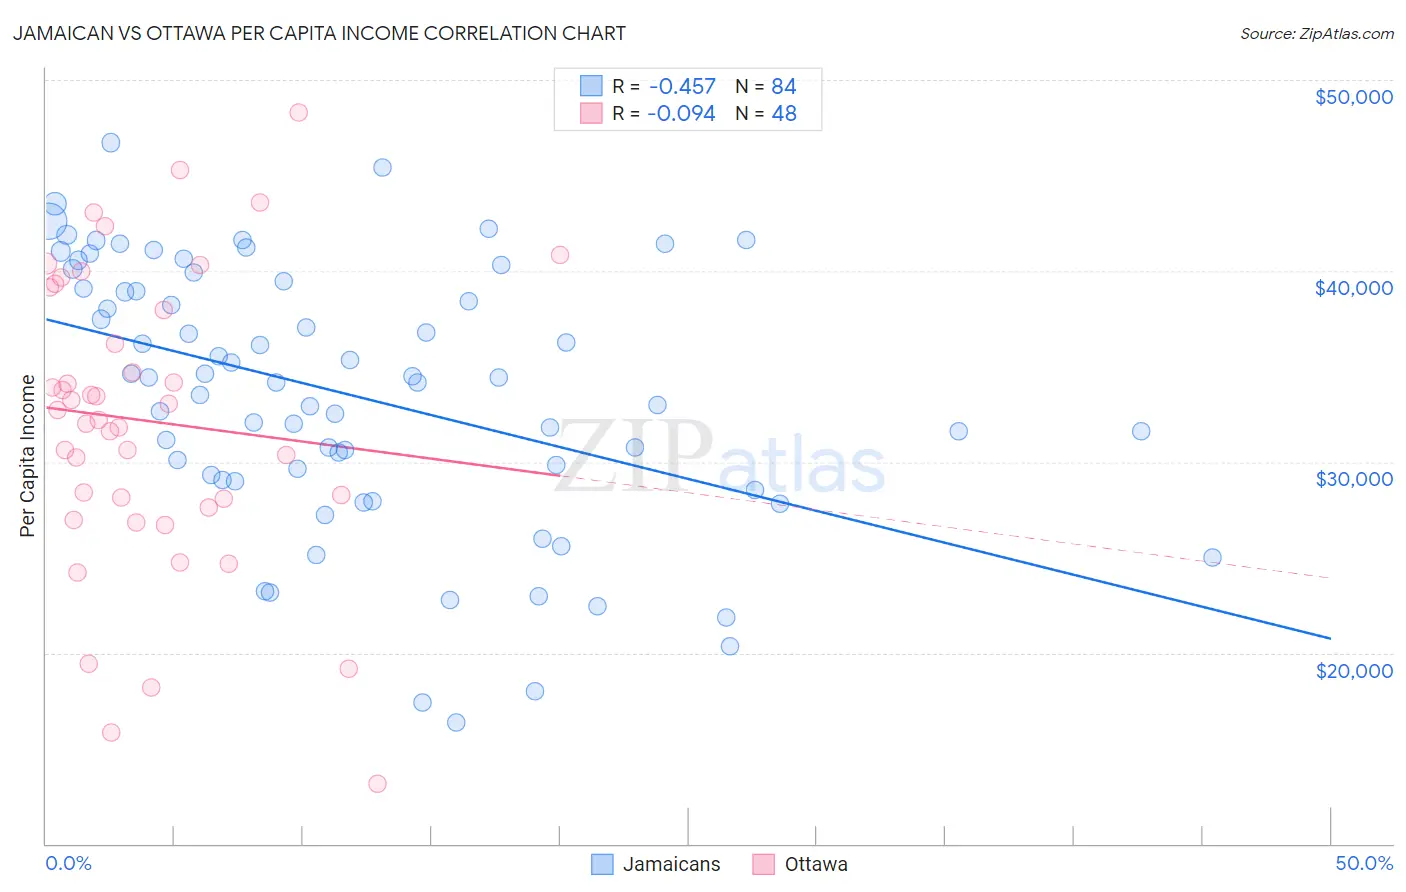
Jamaican vs Ottawa Per Capita Income Correlation Chart
The statistical analysis conducted on geographies consisting of 368,110,686 people shows a moderate negative correlation between the proportion of Jamaicans and per capita income in the United States with a correlation coefficient (R) of -0.457 and weighted average of $39,231. Similarly, the statistical analysis conducted on geographies consisting of 49,956,726 people shows a slight negative correlation between the proportion of Ottawa and per capita income in the United States with a correlation coefficient (R) of -0.094 and weighted average of $37,101, a difference of 5.7%.
Per Capita Income Correlation Summary
| Measurement | Jamaican | Ottawa |
| Minimum | $16,350 | $13,161 |
| Maximum | $46,707 | $48,274 |
| Range | $30,357 | $35,113 |
| Mean | $33,502 | $32,137 |
| Median | $34,287 | $32,448 |
| Interquartile 25% (IQ1) | $29,169 | $27,814 |
| Interquartile 75% (IQ3) | $39,281 | $38,554 |
| Interquartile Range (IQR) | $10,112 | $10,740 |
| Standard Deviation (Sample) | $6,895 | $7,713 |
| Standard Deviation (Population) | $6,854 | $7,632 |
Similar Demographics by Per Capita Income
Demographics Similar to Jamaicans by Per Capita Income
In terms of per capita income, the demographic groups most similar to Jamaicans are Malaysian ($39,194, a difference of 0.090%), Alaskan Athabascan ($39,163, a difference of 0.17%), Marshallese ($39,108, a difference of 0.31%), Iroquois ($39,104, a difference of 0.33%), and Belizean ($39,097, a difference of 0.34%).
| Demographics | Rating | Rank | Per Capita Income |
| Samoans | 1.3 /100 | #251 | Tragic $39,826 |
| Immigrants | Azores | 1.0 /100 | #252 | Tragic $39,608 |
| Osage | 1.0 /100 | #253 | Tragic $39,568 |
| Alaska Natives | 1.0 /100 | #254 | Tragic $39,558 |
| Immigrants | Middle Africa | 1.0 /100 | #255 | Tragic $39,529 |
| Hawaiians | 0.8 /100 | #256 | Tragic $39,403 |
| Nicaraguans | 0.8 /100 | #257 | Tragic $39,372 |
| Jamaicans | 0.7 /100 | #258 | Tragic $39,231 |
| Malaysians | 0.7 /100 | #259 | Tragic $39,194 |
| Alaskan Athabascans | 0.6 /100 | #260 | Tragic $39,163 |
| Marshallese | 0.6 /100 | #261 | Tragic $39,108 |
| Iroquois | 0.6 /100 | #262 | Tragic $39,104 |
| Belizeans | 0.6 /100 | #263 | Tragic $39,097 |
| Americans | 0.6 /100 | #264 | Tragic $39,039 |
| Spanish Americans | 0.5 /100 | #265 | Tragic $39,012 |
Demographics Similar to Ottawa by Per Capita Income
In terms of per capita income, the demographic groups most similar to Ottawa are Shoshone ($37,072, a difference of 0.080%), Paiute ($37,066, a difference of 0.10%), Honduran ($37,031, a difference of 0.19%), Immigrants from Bahamas ($37,193, a difference of 0.25%), and Cherokee ($37,203, a difference of 0.27%).
| Demographics | Rating | Rank | Per Capita Income |
| Cubans | 0.1 /100 | #294 | Tragic $37,383 |
| Immigrants | Dominican Republic | 0.1 /100 | #295 | Tragic $37,306 |
| Indonesians | 0.1 /100 | #296 | Tragic $37,300 |
| Haitians | 0.1 /100 | #297 | Tragic $37,289 |
| Immigrants | Caribbean | 0.1 /100 | #298 | Tragic $37,254 |
| Cherokee | 0.1 /100 | #299 | Tragic $37,203 |
| Immigrants | Bahamas | 0.1 /100 | #300 | Tragic $37,193 |
| Ottawa | 0.1 /100 | #301 | Tragic $37,101 |
| Shoshone | 0.1 /100 | #302 | Tragic $37,072 |
| Paiute | 0.1 /100 | #303 | Tragic $37,066 |
| Hondurans | 0.1 /100 | #304 | Tragic $37,031 |
| Inupiat | 0.1 /100 | #305 | Tragic $36,999 |
| Immigrants | Haiti | 0.0 /100 | #306 | Tragic $36,849 |
| Immigrants | Latin America | 0.0 /100 | #307 | Tragic $36,823 |
| Fijians | 0.0 /100 | #308 | Tragic $36,690 |