Immigrants from Somalia vs Ottawa Per Capita Income
COMPARE
Immigrants from Somalia
Ottawa
Per Capita Income
Per Capita Income Comparison
Immigrants from Somalia
Ottawa
$39,974
PER CAPITA INCOME
1.6/ 100
METRIC RATING
247th/ 347
METRIC RANK
$37,101
PER CAPITA INCOME
0.1/ 100
METRIC RATING
301st/ 347
METRIC RANK
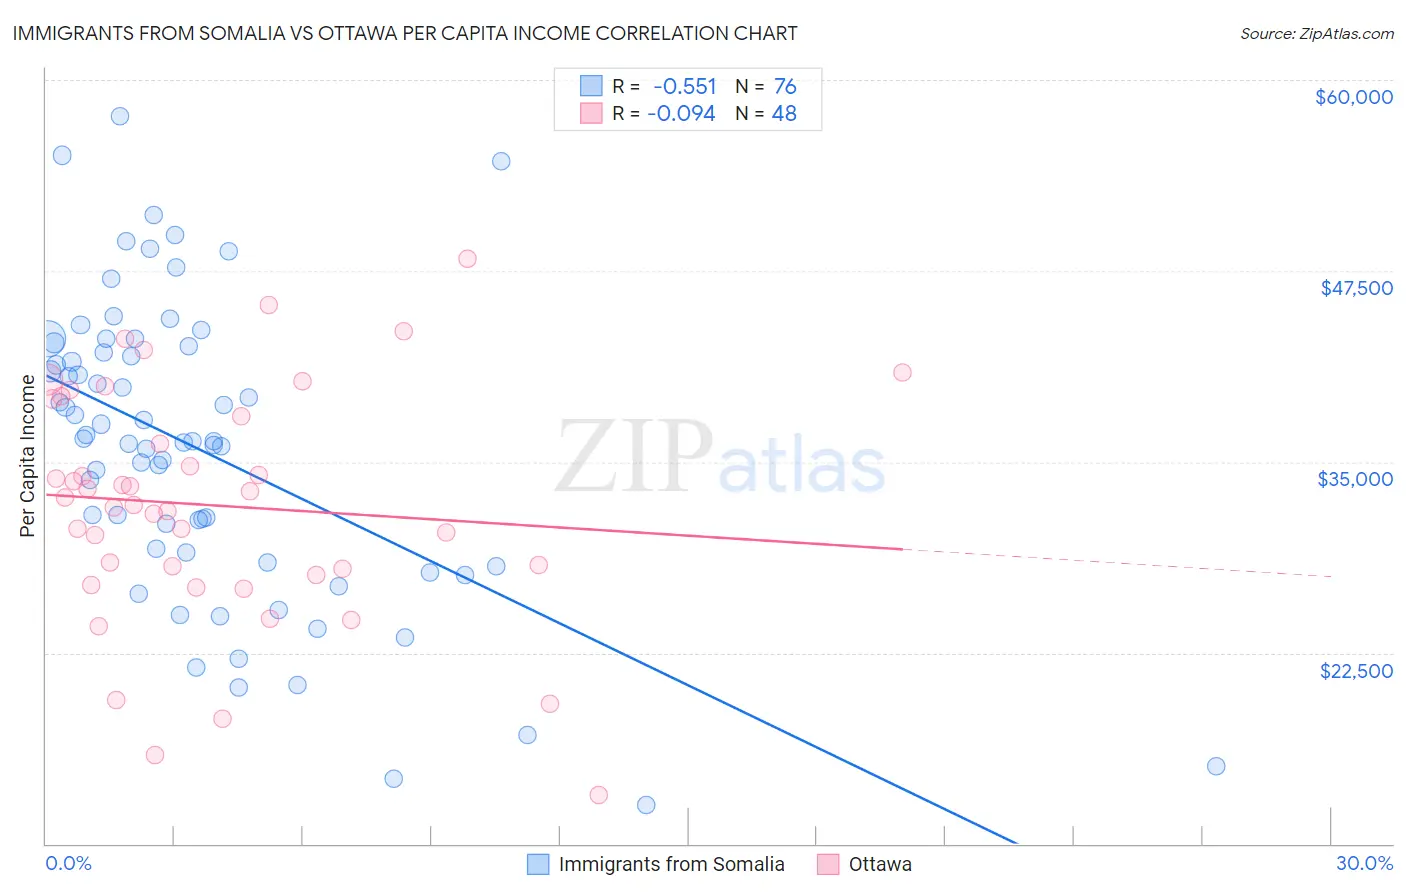
Immigrants from Somalia vs Ottawa Per Capita Income Correlation Chart
The statistical analysis conducted on geographies consisting of 92,111,755 people shows a substantial negative correlation between the proportion of Immigrants from Somalia and per capita income in the United States with a correlation coefficient (R) of -0.551 and weighted average of $39,974. Similarly, the statistical analysis conducted on geographies consisting of 49,956,726 people shows a slight negative correlation between the proportion of Ottawa and per capita income in the United States with a correlation coefficient (R) of -0.094 and weighted average of $37,101, a difference of 7.7%.
Per Capita Income Correlation Summary
| Measurement | Immigrants from Somalia | Ottawa |
| Minimum | $12,576 | $13,161 |
| Maximum | $57,592 | $48,274 |
| Range | $45,016 | $35,113 |
| Mean | $35,739 | $32,137 |
| Median | $36,374 | $32,448 |
| Interquartile 25% (IQ1) | $28,746 | $27,814 |
| Interquartile 75% (IQ3) | $42,371 | $38,554 |
| Interquartile Range (IQR) | $13,624 | $10,740 |
| Standard Deviation (Sample) | $9,785 | $7,713 |
| Standard Deviation (Population) | $9,721 | $7,632 |
Similar Demographics by Per Capita Income
Demographics Similar to Immigrants from Somalia by Per Capita Income
In terms of per capita income, the demographic groups most similar to Immigrants from Somalia are Cape Verdean ($39,935, a difference of 0.10%), Cree ($40,056, a difference of 0.20%), Japanese ($39,870, a difference of 0.26%), Immigrants from Burma/Myanmar ($39,827, a difference of 0.37%), and Samoan ($39,826, a difference of 0.37%).
| Demographics | Rating | Rank | Per Capita Income |
| Immigrants | Nigeria | 2.3 /100 | #240 | Tragic $40,339 |
| British West Indians | 2.3 /100 | #241 | Tragic $40,330 |
| Immigrants | Western Africa | 2.2 /100 | #242 | Tragic $40,294 |
| German Russians | 2.2 /100 | #243 | Tragic $40,266 |
| French American Indians | 2.1 /100 | #244 | Tragic $40,244 |
| Sub-Saharan Africans | 1.9 /100 | #245 | Tragic $40,152 |
| Cree | 1.7 /100 | #246 | Tragic $40,056 |
| Immigrants | Somalia | 1.6 /100 | #247 | Tragic $39,974 |
| Cape Verdeans | 1.5 /100 | #248 | Tragic $39,935 |
| Japanese | 1.4 /100 | #249 | Tragic $39,870 |
| Immigrants | Burma/Myanmar | 1.3 /100 | #250 | Tragic $39,827 |
| Samoans | 1.3 /100 | #251 | Tragic $39,826 |
| Immigrants | Azores | 1.0 /100 | #252 | Tragic $39,608 |
| Osage | 1.0 /100 | #253 | Tragic $39,568 |
| Alaska Natives | 1.0 /100 | #254 | Tragic $39,558 |
Demographics Similar to Ottawa by Per Capita Income
In terms of per capita income, the demographic groups most similar to Ottawa are Shoshone ($37,072, a difference of 0.080%), Paiute ($37,066, a difference of 0.10%), Honduran ($37,031, a difference of 0.19%), Immigrants from Bahamas ($37,193, a difference of 0.25%), and Cherokee ($37,203, a difference of 0.27%).
| Demographics | Rating | Rank | Per Capita Income |
| Cubans | 0.1 /100 | #294 | Tragic $37,383 |
| Immigrants | Dominican Republic | 0.1 /100 | #295 | Tragic $37,306 |
| Indonesians | 0.1 /100 | #296 | Tragic $37,300 |
| Haitians | 0.1 /100 | #297 | Tragic $37,289 |
| Immigrants | Caribbean | 0.1 /100 | #298 | Tragic $37,254 |
| Cherokee | 0.1 /100 | #299 | Tragic $37,203 |
| Immigrants | Bahamas | 0.1 /100 | #300 | Tragic $37,193 |
| Ottawa | 0.1 /100 | #301 | Tragic $37,101 |
| Shoshone | 0.1 /100 | #302 | Tragic $37,072 |
| Paiute | 0.1 /100 | #303 | Tragic $37,066 |
| Hondurans | 0.1 /100 | #304 | Tragic $37,031 |
| Inupiat | 0.1 /100 | #305 | Tragic $36,999 |
| Immigrants | Haiti | 0.0 /100 | #306 | Tragic $36,849 |
| Immigrants | Latin America | 0.0 /100 | #307 | Tragic $36,823 |
| Fijians | 0.0 /100 | #308 | Tragic $36,690 |