English vs Ottawa Per Capita Income
COMPARE
English
Ottawa
Per Capita Income
Per Capita Income Comparison
English
Ottawa
$43,982
PER CAPITA INCOME
58.9/ 100
METRIC RATING
167th/ 347
METRIC RANK
$37,101
PER CAPITA INCOME
0.1/ 100
METRIC RATING
301st/ 347
METRIC RANK
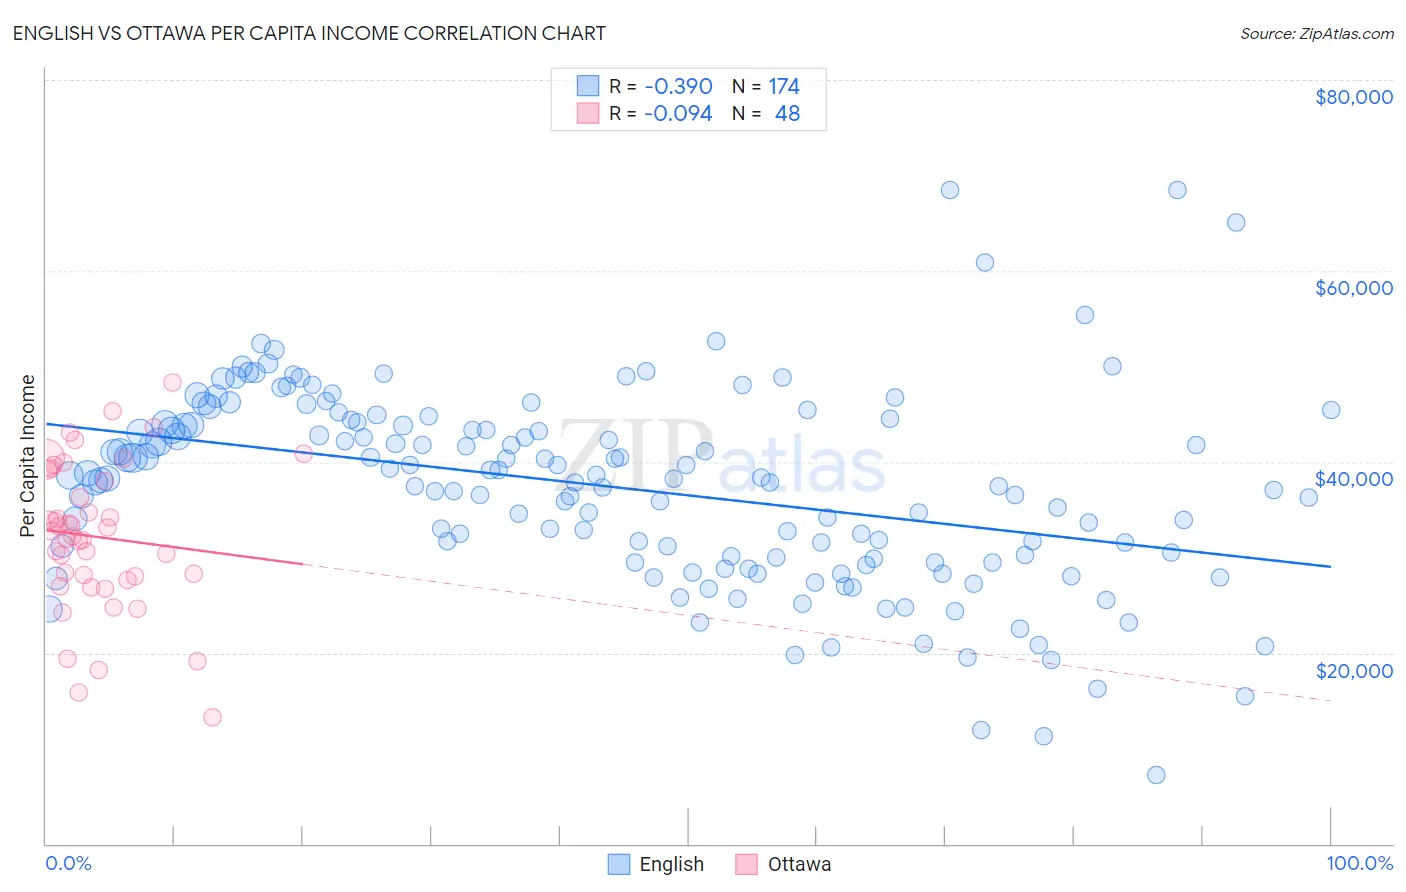
English vs Ottawa Per Capita Income Correlation Chart
The statistical analysis conducted on geographies consisting of 580,041,700 people shows a mild negative correlation between the proportion of English and per capita income in the United States with a correlation coefficient (R) of -0.390 and weighted average of $43,982. Similarly, the statistical analysis conducted on geographies consisting of 49,956,726 people shows a slight negative correlation between the proportion of Ottawa and per capita income in the United States with a correlation coefficient (R) of -0.094 and weighted average of $37,101, a difference of 18.5%.
Per Capita Income Correlation Summary
| Measurement | English | Ottawa |
| Minimum | $7,241 | $13,161 |
| Maximum | $68,486 | $48,274 |
| Range | $61,245 | $35,113 |
| Mean | $37,333 | $32,137 |
| Median | $38,254 | $32,448 |
| Interquartile 25% (IQ1) | $30,036 | $27,814 |
| Interquartile 75% (IQ3) | $44,055 | $38,554 |
| Interquartile Range (IQR) | $14,019 | $10,740 |
| Standard Deviation (Sample) | $10,214 | $7,713 |
| Standard Deviation (Population) | $10,184 | $7,632 |
Similar Demographics by Per Capita Income
Demographics Similar to English by Per Capita Income
In terms of per capita income, the demographic groups most similar to English are Immigrants from Uruguay ($43,997, a difference of 0.030%), Immigrants from Philippines ($44,000, a difference of 0.040%), Sri Lankan ($44,014, a difference of 0.070%), Belgian ($43,951, a difference of 0.070%), and Immigrants from South America ($44,068, a difference of 0.19%).
| Demographics | Rating | Rank | Per Capita Income |
| Danes | 61.9 /100 | #160 | Good $44,095 |
| Costa Ricans | 61.8 /100 | #161 | Good $44,090 |
| Swiss | 61.4 /100 | #162 | Good $44,076 |
| Immigrants | South America | 61.2 /100 | #163 | Good $44,068 |
| Sri Lankans | 59.8 /100 | #164 | Average $44,014 |
| Immigrants | Philippines | 59.4 /100 | #165 | Average $44,000 |
| Immigrants | Uruguay | 59.3 /100 | #166 | Average $43,997 |
| English | 58.9 /100 | #167 | Average $43,982 |
| Belgians | 58.1 /100 | #168 | Average $43,951 |
| Immigrants | Peru | 55.3 /100 | #169 | Average $43,852 |
| Scandinavians | 55.2 /100 | #170 | Average $43,848 |
| Immigrants | Eastern Africa | 54.9 /100 | #171 | Average $43,838 |
| Czechoslovakians | 54.1 /100 | #172 | Average $43,806 |
| French | 50.7 /100 | #173 | Average $43,685 |
| Colombians | 50.0 /100 | #174 | Average $43,661 |
Demographics Similar to Ottawa by Per Capita Income
In terms of per capita income, the demographic groups most similar to Ottawa are Shoshone ($37,072, a difference of 0.080%), Paiute ($37,066, a difference of 0.10%), Honduran ($37,031, a difference of 0.19%), Immigrants from Bahamas ($37,193, a difference of 0.25%), and Cherokee ($37,203, a difference of 0.27%).
| Demographics | Rating | Rank | Per Capita Income |
| Cubans | 0.1 /100 | #294 | Tragic $37,383 |
| Immigrants | Dominican Republic | 0.1 /100 | #295 | Tragic $37,306 |
| Indonesians | 0.1 /100 | #296 | Tragic $37,300 |
| Haitians | 0.1 /100 | #297 | Tragic $37,289 |
| Immigrants | Caribbean | 0.1 /100 | #298 | Tragic $37,254 |
| Cherokee | 0.1 /100 | #299 | Tragic $37,203 |
| Immigrants | Bahamas | 0.1 /100 | #300 | Tragic $37,193 |
| Ottawa | 0.1 /100 | #301 | Tragic $37,101 |
| Shoshone | 0.1 /100 | #302 | Tragic $37,072 |
| Paiute | 0.1 /100 | #303 | Tragic $37,066 |
| Hondurans | 0.1 /100 | #304 | Tragic $37,031 |
| Inupiat | 0.1 /100 | #305 | Tragic $36,999 |
| Immigrants | Haiti | 0.0 /100 | #306 | Tragic $36,849 |
| Immigrants | Latin America | 0.0 /100 | #307 | Tragic $36,823 |
| Fijians | 0.0 /100 | #308 | Tragic $36,690 |