Iroquois vs Zimbabwean Median Family Income
COMPARE
Iroquois
Zimbabwean
Median Family Income
Median Family Income Comparison
Iroquois
Zimbabweans
$90,543
MEDIAN FAMILY INCOME
0.2/ 100
METRIC RATING
271st/ 347
METRIC RANK
$110,011
MEDIAN FAMILY INCOME
97.7/ 100
METRIC RATING
95th/ 347
METRIC RANK
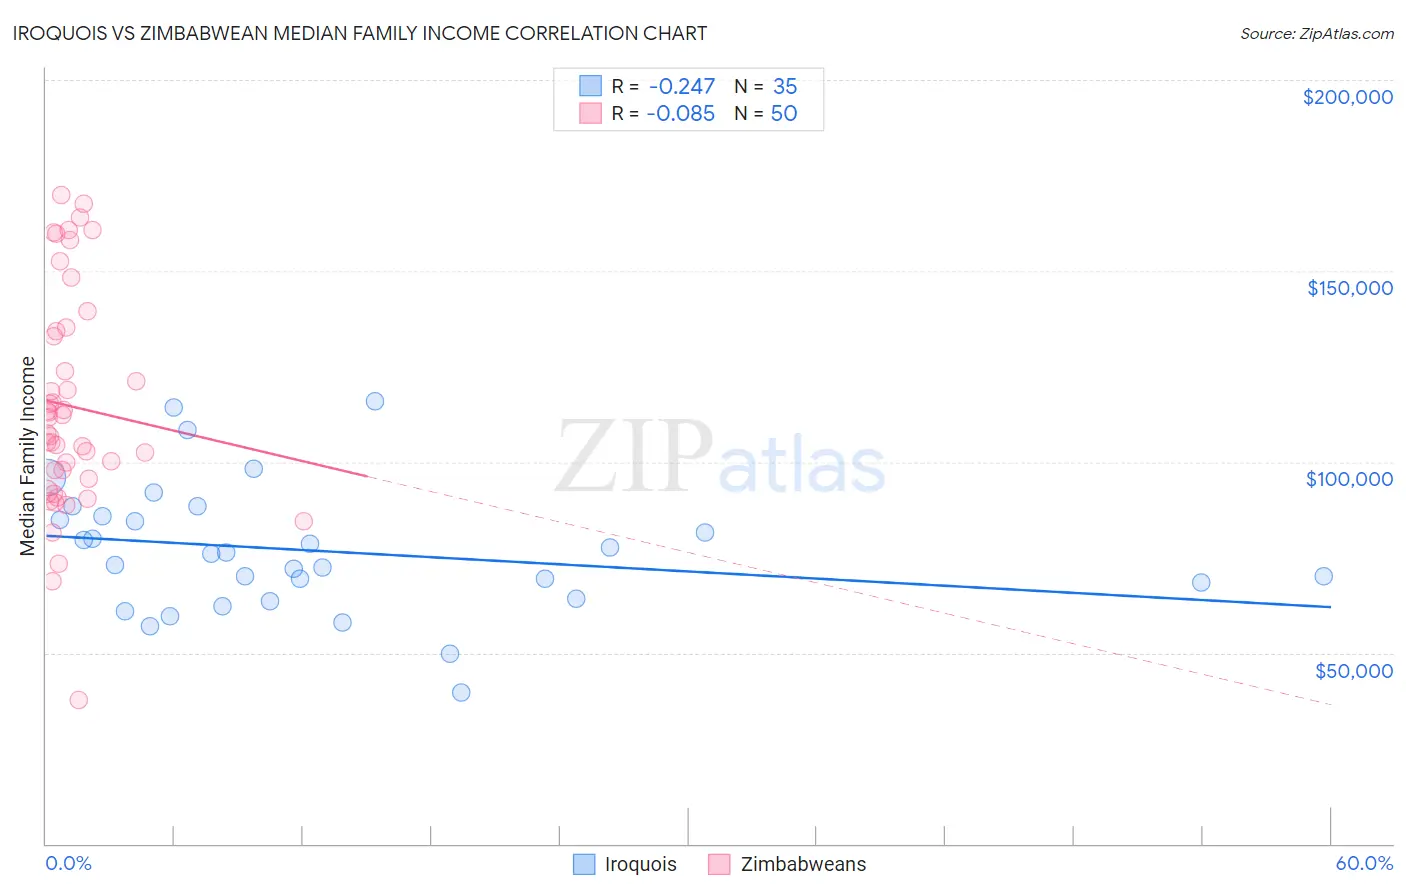
Iroquois vs Zimbabwean Median Family Income Correlation Chart
The statistical analysis conducted on geographies consisting of 207,203,022 people shows a weak negative correlation between the proportion of Iroquois and median family income in the United States with a correlation coefficient (R) of -0.247 and weighted average of $90,543. Similarly, the statistical analysis conducted on geographies consisting of 69,185,684 people shows a slight negative correlation between the proportion of Zimbabweans and median family income in the United States with a correlation coefficient (R) of -0.085 and weighted average of $110,011, a difference of 21.5%.
Median Family Income Correlation Summary
| Measurement | Iroquois | Zimbabwean |
| Minimum | $39,479 | $37,500 |
| Maximum | $115,891 | $169,922 |
| Range | $76,412 | $132,422 |
| Mean | $76,689 | $114,541 |
| Median | $75,795 | $109,407 |
| Interquartile 25% (IQ1) | $64,141 | $95,466 |
| Interquartile 75% (IQ3) | $85,646 | $134,100 |
| Interquartile Range (IQR) | $21,505 | $38,634 |
| Standard Deviation (Sample) | $16,973 | $28,953 |
| Standard Deviation (Population) | $16,729 | $28,662 |
Similar Demographics by Median Family Income
Demographics Similar to Iroquois by Median Family Income
In terms of median family income, the demographic groups most similar to Iroquois are Jamaican ($90,581, a difference of 0.040%), Immigrants from Liberia ($90,450, a difference of 0.10%), Immigrants from Micronesia ($90,345, a difference of 0.22%), Spanish American ($90,322, a difference of 0.24%), and Cree ($90,882, a difference of 0.37%).
| Demographics | Rating | Rank | Median Family Income |
| Senegalese | 0.3 /100 | #264 | Tragic $91,475 |
| Hmong | 0.3 /100 | #265 | Tragic $91,296 |
| Central Americans | 0.3 /100 | #266 | Tragic $91,087 |
| Mexican American Indians | 0.2 /100 | #267 | Tragic $90,918 |
| Cree | 0.2 /100 | #268 | Tragic $90,882 |
| Belizeans | 0.2 /100 | #269 | Tragic $90,880 |
| Jamaicans | 0.2 /100 | #270 | Tragic $90,581 |
| Iroquois | 0.2 /100 | #271 | Tragic $90,543 |
| Immigrants | Liberia | 0.2 /100 | #272 | Tragic $90,450 |
| Immigrants | Micronesia | 0.2 /100 | #273 | Tragic $90,345 |
| Spanish Americans | 0.2 /100 | #274 | Tragic $90,322 |
| Immigrants | St. Vincent and the Grenadines | 0.2 /100 | #275 | Tragic $90,094 |
| Immigrants | Zaire | 0.1 /100 | #276 | Tragic $89,285 |
| Immigrants | Jamaica | 0.1 /100 | #277 | Tragic $89,268 |
| Immigrants | Grenada | 0.1 /100 | #278 | Tragic $89,249 |
Demographics Similar to Zimbabweans by Median Family Income
In terms of median family income, the demographic groups most similar to Zimbabweans are Immigrants from Moldova ($109,975, a difference of 0.030%), Korean ($110,103, a difference of 0.080%), Immigrants from Kazakhstan ($110,137, a difference of 0.11%), Immigrants from Lebanon ($110,159, a difference of 0.13%), and Jordanian ($109,865, a difference of 0.13%).
| Demographics | Rating | Rank | Median Family Income |
| Romanians | 98.8 /100 | #88 | Exceptional $111,243 |
| Immigrants | Argentina | 98.5 /100 | #89 | Exceptional $110,873 |
| Northern Europeans | 98.3 /100 | #90 | Exceptional $110,635 |
| Immigrants | Southern Europe | 98.3 /100 | #91 | Exceptional $110,614 |
| Immigrants | Lebanon | 97.9 /100 | #92 | Exceptional $110,159 |
| Immigrants | Kazakhstan | 97.8 /100 | #93 | Exceptional $110,137 |
| Koreans | 97.8 /100 | #94 | Exceptional $110,103 |
| Zimbabweans | 97.7 /100 | #95 | Exceptional $110,011 |
| Immigrants | Moldova | 97.7 /100 | #96 | Exceptional $109,975 |
| Jordanians | 97.5 /100 | #97 | Exceptional $109,865 |
| Immigrants | Kuwait | 97.4 /100 | #98 | Exceptional $109,731 |
| Armenians | 97.3 /100 | #99 | Exceptional $109,692 |
| Macedonians | 97.3 /100 | #100 | Exceptional $109,668 |
| Immigrants | Ukraine | 97.2 /100 | #101 | Exceptional $109,645 |
| Assyrians/Chaldeans/Syriacs | 97.2 /100 | #102 | Exceptional $109,622 |