Welsh vs Yugoslavian Median Family Income
COMPARE
Welsh
Yugoslavian
Median Family Income
Median Family Income Comparison
Welsh
Yugoslavians
$102,151
MEDIAN FAMILY INCOME
43.3/ 100
METRIC RATING
178th/ 347
METRIC RANK
$100,119
MEDIAN FAMILY INCOME
21.3/ 100
METRIC RATING
199th/ 347
METRIC RANK
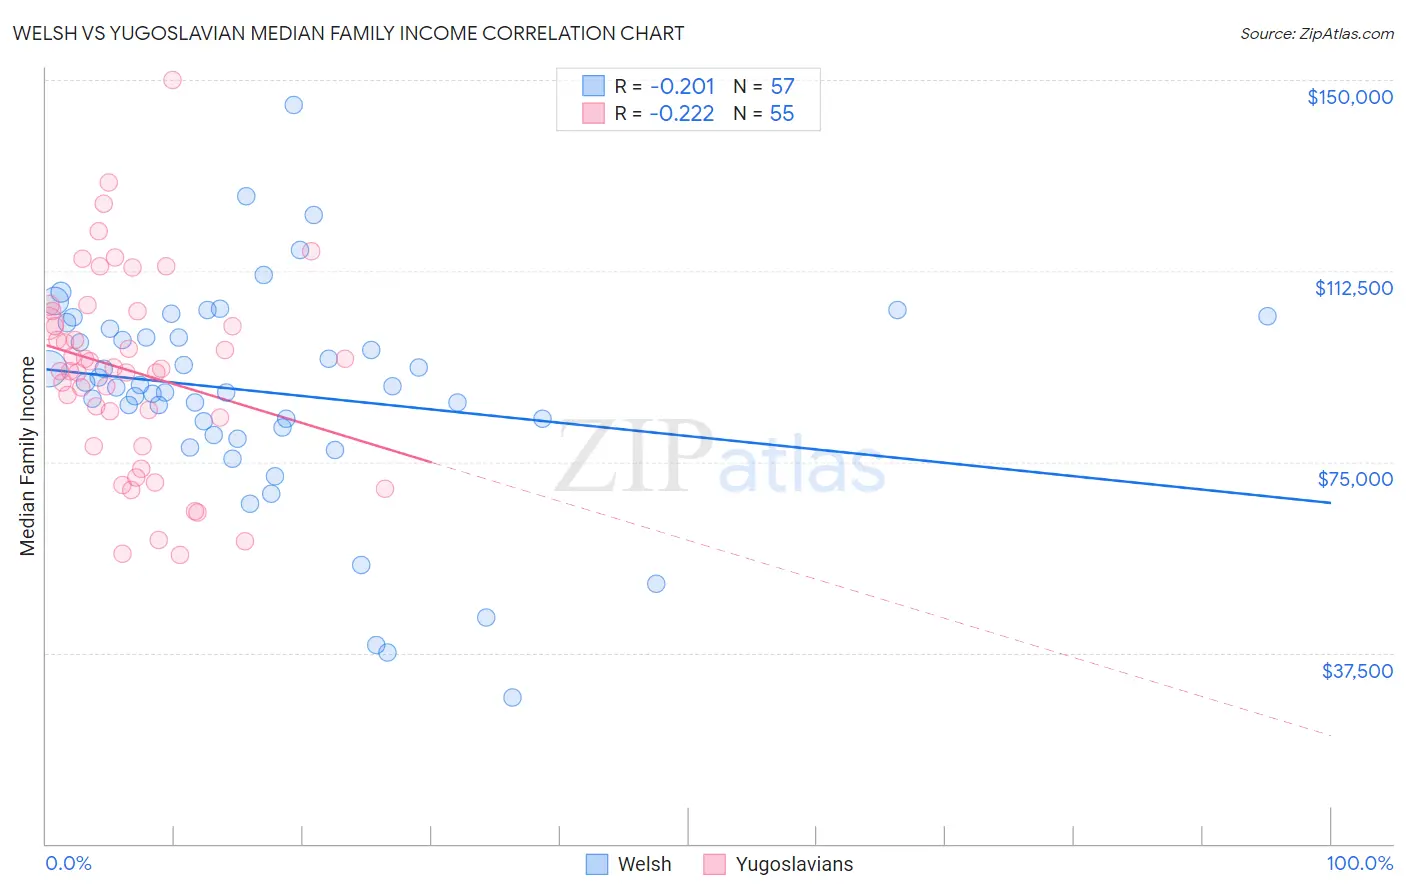
Welsh vs Yugoslavian Median Family Income Correlation Chart
The statistical analysis conducted on geographies consisting of 527,824,493 people shows a weak negative correlation between the proportion of Welsh and median family income in the United States with a correlation coefficient (R) of -0.201 and weighted average of $102,151. Similarly, the statistical analysis conducted on geographies consisting of 285,576,130 people shows a weak negative correlation between the proportion of Yugoslavians and median family income in the United States with a correlation coefficient (R) of -0.222 and weighted average of $100,119, a difference of 2.0%.
Median Family Income Correlation Summary
| Measurement | Welsh | Yugoslavian |
| Minimum | $28,750 | $56,660 |
| Maximum | $145,055 | $150,000 |
| Range | $116,305 | $93,340 |
| Mean | $88,686 | $92,781 |
| Median | $89,832 | $93,214 |
| Interquartile 25% (IQ1) | $80,992 | $78,167 |
| Interquartile 75% (IQ3) | $101,775 | $104,589 |
| Interquartile Range (IQR) | $20,783 | $26,422 |
| Standard Deviation (Sample) | $21,326 | $19,367 |
| Standard Deviation (Population) | $21,138 | $19,191 |
Similar Demographics by Median Family Income
Demographics Similar to Welsh by Median Family Income
In terms of median family income, the demographic groups most similar to Welsh are German ($102,254, a difference of 0.10%), French ($102,368, a difference of 0.21%), Immigrants from Eastern Africa ($102,451, a difference of 0.29%), South American ($101,856, a difference of 0.29%), and Finnish ($102,676, a difference of 0.51%).
| Demographics | Rating | Rank | Median Family Income |
| Alsatians | 54.3 /100 | #171 | Average $103,010 |
| Immigrants | Eritrea | 51.9 /100 | #172 | Average $102,823 |
| Belgians | 51.4 /100 | #173 | Average $102,788 |
| Finns | 50.0 /100 | #174 | Average $102,676 |
| Immigrants | Eastern Africa | 47.1 /100 | #175 | Average $102,451 |
| French | 46.1 /100 | #176 | Average $102,368 |
| Germans | 44.6 /100 | #177 | Average $102,254 |
| Welsh | 43.3 /100 | #178 | Average $102,151 |
| South Americans | 39.7 /100 | #179 | Fair $101,856 |
| French Canadians | 37.0 /100 | #180 | Fair $101,634 |
| Spaniards | 36.8 /100 | #181 | Fair $101,617 |
| Tsimshian | 35.9 /100 | #182 | Fair $101,543 |
| Kenyans | 34.5 /100 | #183 | Fair $101,417 |
| Immigrants | Costa Rica | 33.7 /100 | #184 | Fair $101,354 |
| Dutch | 31.9 /100 | #185 | Fair $101,192 |
Demographics Similar to Yugoslavians by Median Family Income
In terms of median family income, the demographic groups most similar to Yugoslavians are Immigrants from Africa ($100,256, a difference of 0.14%), Spanish ($99,977, a difference of 0.14%), Immigrants from Cameroon ($100,289, a difference of 0.17%), Samoan ($100,344, a difference of 0.22%), and Immigrants from Thailand ($99,840, a difference of 0.28%).
| Demographics | Rating | Rank | Median Family Income |
| Immigrants | Kenya | 26.5 /100 | #192 | Fair $100,679 |
| Iraqis | 26.3 /100 | #193 | Fair $100,658 |
| Uruguayans | 26.3 /100 | #194 | Fair $100,656 |
| Immigrants | South America | 23.9 /100 | #195 | Fair $100,414 |
| Samoans | 23.3 /100 | #196 | Fair $100,344 |
| Immigrants | Cameroon | 22.8 /100 | #197 | Fair $100,289 |
| Immigrants | Africa | 22.5 /100 | #198 | Fair $100,256 |
| Yugoslavians | 21.3 /100 | #199 | Fair $100,119 |
| Spanish | 20.1 /100 | #200 | Fair $99,977 |
| Immigrants | Thailand | 19.0 /100 | #201 | Poor $99,840 |
| Whites/Caucasians | 18.7 /100 | #202 | Poor $99,800 |
| Scotch-Irish | 17.1 /100 | #203 | Poor $99,591 |
| Ghanaians | 12.6 /100 | #204 | Poor $98,877 |
| Hawaiians | 12.5 /100 | #205 | Poor $98,869 |
| Immigrants | Iraq | 12.1 /100 | #206 | Poor $98,786 |