Liberian vs Yugoslavian Median Family Income
COMPARE
Liberian
Yugoslavian
Median Family Income
Median Family Income Comparison
Liberians
Yugoslavians
$91,722
MEDIAN FAMILY INCOME
0.4/ 100
METRIC RATING
262nd/ 347
METRIC RANK
$100,119
MEDIAN FAMILY INCOME
21.3/ 100
METRIC RATING
199th/ 347
METRIC RANK
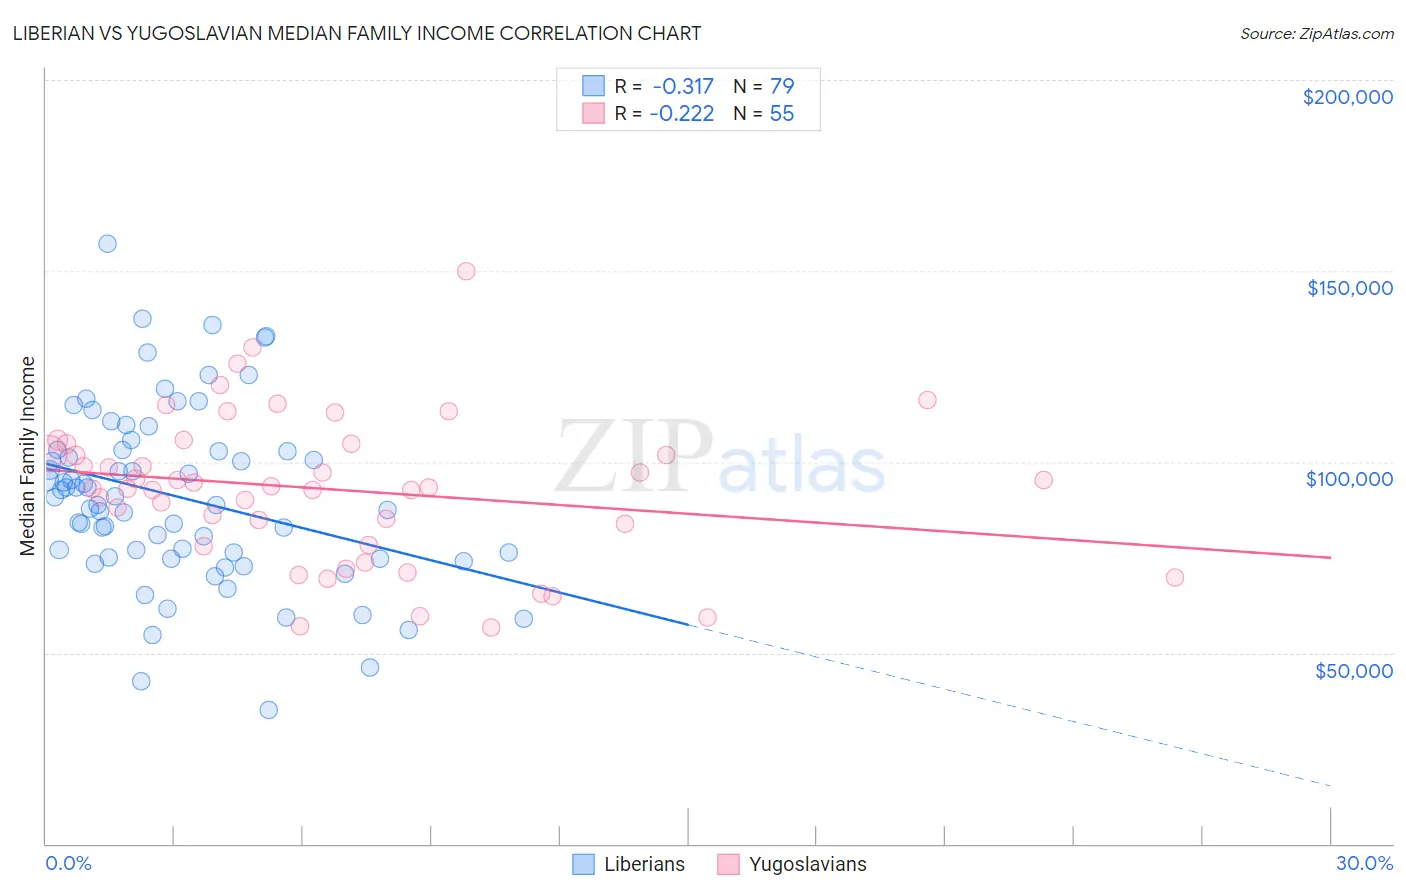
Liberian vs Yugoslavian Median Family Income Correlation Chart
The statistical analysis conducted on geographies consisting of 118,024,273 people shows a mild negative correlation between the proportion of Liberians and median family income in the United States with a correlation coefficient (R) of -0.317 and weighted average of $91,722. Similarly, the statistical analysis conducted on geographies consisting of 285,576,130 people shows a weak negative correlation between the proportion of Yugoslavians and median family income in the United States with a correlation coefficient (R) of -0.222 and weighted average of $100,119, a difference of 9.2%.
Median Family Income Correlation Summary
| Measurement | Liberian | Yugoslavian |
| Minimum | $34,978 | $56,660 |
| Maximum | $157,083 | $150,000 |
| Range | $122,105 | $93,340 |
| Mean | $90,813 | $92,781 |
| Median | $90,810 | $93,214 |
| Interquartile 25% (IQ1) | $74,960 | $78,167 |
| Interquartile 75% (IQ3) | $103,000 | $104,589 |
| Interquartile Range (IQR) | $28,040 | $26,422 |
| Standard Deviation (Sample) | $23,045 | $19,367 |
| Standard Deviation (Population) | $22,899 | $19,191 |
Similar Demographics by Median Family Income
Demographics Similar to Liberians by Median Family Income
In terms of median family income, the demographic groups most similar to Liberians are Inupiat ($91,730, a difference of 0.010%), Pennsylvania German ($91,763, a difference of 0.040%), Cape Verdean ($91,848, a difference of 0.14%), Immigrants from West Indies ($91,588, a difference of 0.15%), and Osage ($91,926, a difference of 0.22%).
| Demographics | Rating | Rank | Median Family Income |
| Immigrants | Laos | 0.5 /100 | #255 | Tragic $92,239 |
| Nicaraguans | 0.5 /100 | #256 | Tragic $92,231 |
| Americans | 0.4 /100 | #257 | Tragic $92,096 |
| Osage | 0.4 /100 | #258 | Tragic $91,926 |
| Cape Verdeans | 0.4 /100 | #259 | Tragic $91,848 |
| Pennsylvania Germans | 0.4 /100 | #260 | Tragic $91,763 |
| Inupiat | 0.4 /100 | #261 | Tragic $91,730 |
| Liberians | 0.4 /100 | #262 | Tragic $91,722 |
| Immigrants | West Indies | 0.3 /100 | #263 | Tragic $91,588 |
| Senegalese | 0.3 /100 | #264 | Tragic $91,475 |
| Hmong | 0.3 /100 | #265 | Tragic $91,296 |
| Central Americans | 0.3 /100 | #266 | Tragic $91,087 |
| Mexican American Indians | 0.2 /100 | #267 | Tragic $90,918 |
| Cree | 0.2 /100 | #268 | Tragic $90,882 |
| Belizeans | 0.2 /100 | #269 | Tragic $90,880 |
Demographics Similar to Yugoslavians by Median Family Income
In terms of median family income, the demographic groups most similar to Yugoslavians are Immigrants from Africa ($100,256, a difference of 0.14%), Spanish ($99,977, a difference of 0.14%), Immigrants from Cameroon ($100,289, a difference of 0.17%), Samoan ($100,344, a difference of 0.22%), and Immigrants from Thailand ($99,840, a difference of 0.28%).
| Demographics | Rating | Rank | Median Family Income |
| Immigrants | Kenya | 26.5 /100 | #192 | Fair $100,679 |
| Iraqis | 26.3 /100 | #193 | Fair $100,658 |
| Uruguayans | 26.3 /100 | #194 | Fair $100,656 |
| Immigrants | South America | 23.9 /100 | #195 | Fair $100,414 |
| Samoans | 23.3 /100 | #196 | Fair $100,344 |
| Immigrants | Cameroon | 22.8 /100 | #197 | Fair $100,289 |
| Immigrants | Africa | 22.5 /100 | #198 | Fair $100,256 |
| Yugoslavians | 21.3 /100 | #199 | Fair $100,119 |
| Spanish | 20.1 /100 | #200 | Fair $99,977 |
| Immigrants | Thailand | 19.0 /100 | #201 | Poor $99,840 |
| Whites/Caucasians | 18.7 /100 | #202 | Poor $99,800 |
| Scotch-Irish | 17.1 /100 | #203 | Poor $99,591 |
| Ghanaians | 12.6 /100 | #204 | Poor $98,877 |
| Hawaiians | 12.5 /100 | #205 | Poor $98,869 |
| Immigrants | Iraq | 12.1 /100 | #206 | Poor $98,786 |