Moroccan vs Yugoslavian Median Family Income
COMPARE
Moroccan
Yugoslavian
Median Family Income
Median Family Income Comparison
Moroccans
Yugoslavians
$104,488
MEDIAN FAMILY INCOME
71.6/ 100
METRIC RATING
157th/ 347
METRIC RANK
$100,119
MEDIAN FAMILY INCOME
21.3/ 100
METRIC RATING
199th/ 347
METRIC RANK
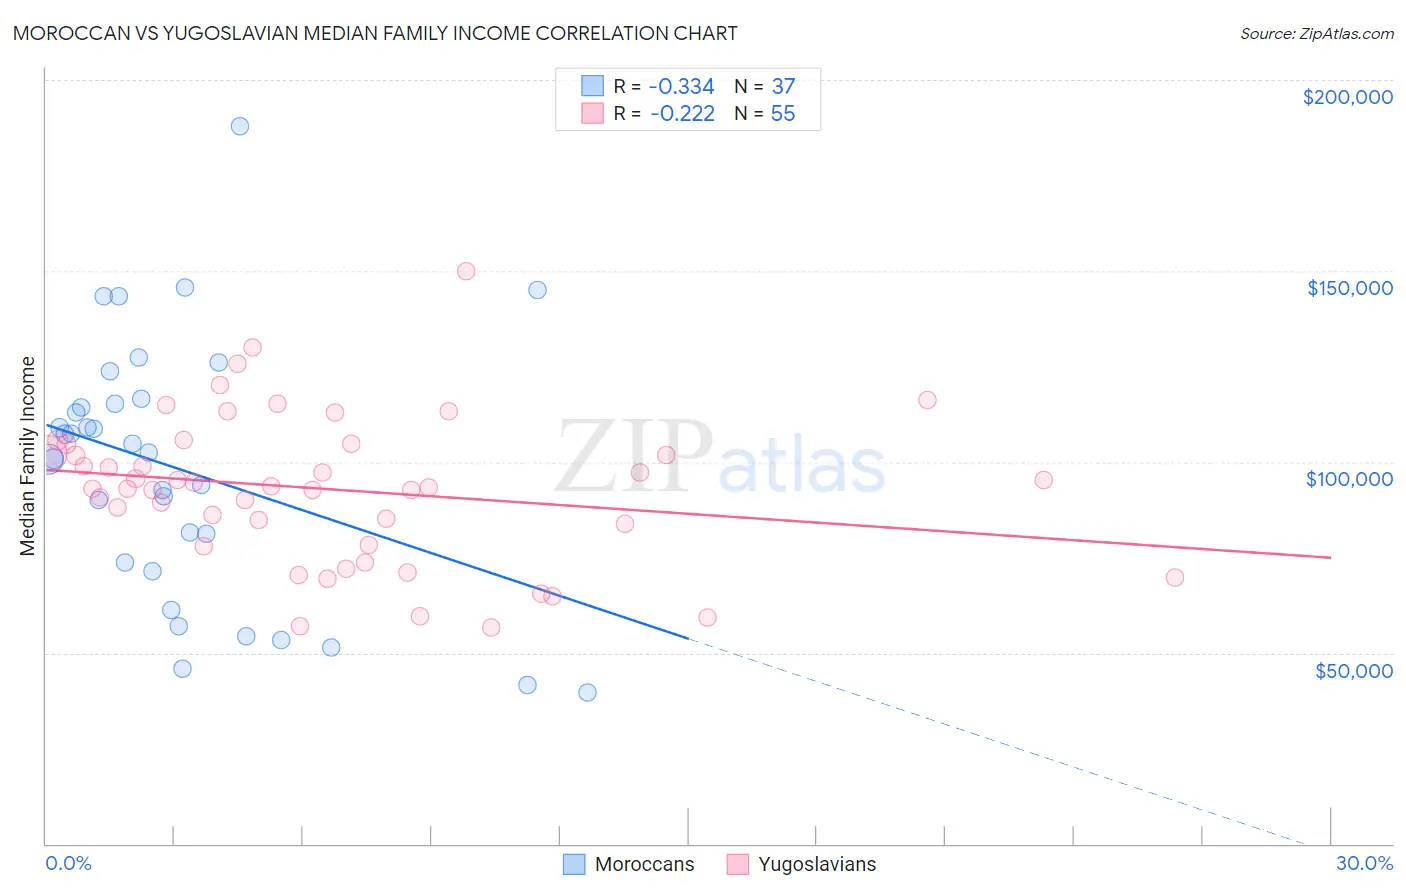
Moroccan vs Yugoslavian Median Family Income Correlation Chart
The statistical analysis conducted on geographies consisting of 201,715,101 people shows a mild negative correlation between the proportion of Moroccans and median family income in the United States with a correlation coefficient (R) of -0.334 and weighted average of $104,488. Similarly, the statistical analysis conducted on geographies consisting of 285,576,130 people shows a weak negative correlation between the proportion of Yugoslavians and median family income in the United States with a correlation coefficient (R) of -0.222 and weighted average of $100,119, a difference of 4.4%.
Median Family Income Correlation Summary
| Measurement | Moroccan | Yugoslavian |
| Minimum | $39,712 | $56,660 |
| Maximum | $187,788 | $150,000 |
| Range | $148,076 | $93,340 |
| Mean | $98,112 | $92,781 |
| Median | $102,324 | $93,214 |
| Interquartile 25% (IQ1) | $72,461 | $78,167 |
| Interquartile 75% (IQ3) | $115,754 | $104,589 |
| Interquartile Range (IQR) | $43,293 | $26,422 |
| Standard Deviation (Sample) | $33,816 | $19,367 |
| Standard Deviation (Population) | $33,356 | $19,191 |
Similar Demographics by Median Family Income
Demographics Similar to Moroccans by Median Family Income
In terms of median family income, the demographic groups most similar to Moroccans are Scandinavian ($104,410, a difference of 0.080%), Swiss ($104,396, a difference of 0.090%), Scottish ($104,288, a difference of 0.19%), Icelander ($104,282, a difference of 0.20%), and Basque ($104,760, a difference of 0.26%).
| Demographics | Rating | Rank | Median Family Income |
| Irish | 80.5 /100 | #150 | Excellent $105,453 |
| Peruvians | 80.4 /100 | #151 | Excellent $105,444 |
| Immigrants | Albania | 79.1 /100 | #152 | Good $105,285 |
| Slavs | 77.9 /100 | #153 | Good $105,144 |
| Immigrants | Nepal | 76.3 /100 | #154 | Good $104,966 |
| Native Hawaiians | 75.8 /100 | #155 | Good $104,910 |
| Basques | 74.4 /100 | #156 | Good $104,760 |
| Moroccans | 71.6 /100 | #157 | Good $104,488 |
| Scandinavians | 70.8 /100 | #158 | Good $104,410 |
| Swiss | 70.7 /100 | #159 | Good $104,396 |
| Scottish | 69.5 /100 | #160 | Good $104,288 |
| Icelanders | 69.4 /100 | #161 | Good $104,282 |
| Immigrants | Sierra Leone | 66.2 /100 | #162 | Good $103,990 |
| Costa Ricans | 66.2 /100 | #163 | Good $103,989 |
| Sierra Leoneans | 64.7 /100 | #164 | Good $103,859 |
Demographics Similar to Yugoslavians by Median Family Income
In terms of median family income, the demographic groups most similar to Yugoslavians are Immigrants from Africa ($100,256, a difference of 0.14%), Spanish ($99,977, a difference of 0.14%), Immigrants from Cameroon ($100,289, a difference of 0.17%), Samoan ($100,344, a difference of 0.22%), and Immigrants from Thailand ($99,840, a difference of 0.28%).
| Demographics | Rating | Rank | Median Family Income |
| Immigrants | Kenya | 26.5 /100 | #192 | Fair $100,679 |
| Iraqis | 26.3 /100 | #193 | Fair $100,658 |
| Uruguayans | 26.3 /100 | #194 | Fair $100,656 |
| Immigrants | South America | 23.9 /100 | #195 | Fair $100,414 |
| Samoans | 23.3 /100 | #196 | Fair $100,344 |
| Immigrants | Cameroon | 22.8 /100 | #197 | Fair $100,289 |
| Immigrants | Africa | 22.5 /100 | #198 | Fair $100,256 |
| Yugoslavians | 21.3 /100 | #199 | Fair $100,119 |
| Spanish | 20.1 /100 | #200 | Fair $99,977 |
| Immigrants | Thailand | 19.0 /100 | #201 | Poor $99,840 |
| Whites/Caucasians | 18.7 /100 | #202 | Poor $99,800 |
| Scotch-Irish | 17.1 /100 | #203 | Poor $99,591 |
| Ghanaians | 12.6 /100 | #204 | Poor $98,877 |
| Hawaiians | 12.5 /100 | #205 | Poor $98,869 |
| Immigrants | Iraq | 12.1 /100 | #206 | Poor $98,786 |