Romanian vs Panamanian Median Family Income
COMPARE
Romanian
Panamanian
Median Family Income
Median Family Income Comparison
Romanians
Panamanians
$111,243
MEDIAN FAMILY INCOME
98.8/ 100
METRIC RATING
88th/ 347
METRIC RANK
$97,683
MEDIAN FAMILY INCOME
7.2/ 100
METRIC RATING
212th/ 347
METRIC RANK
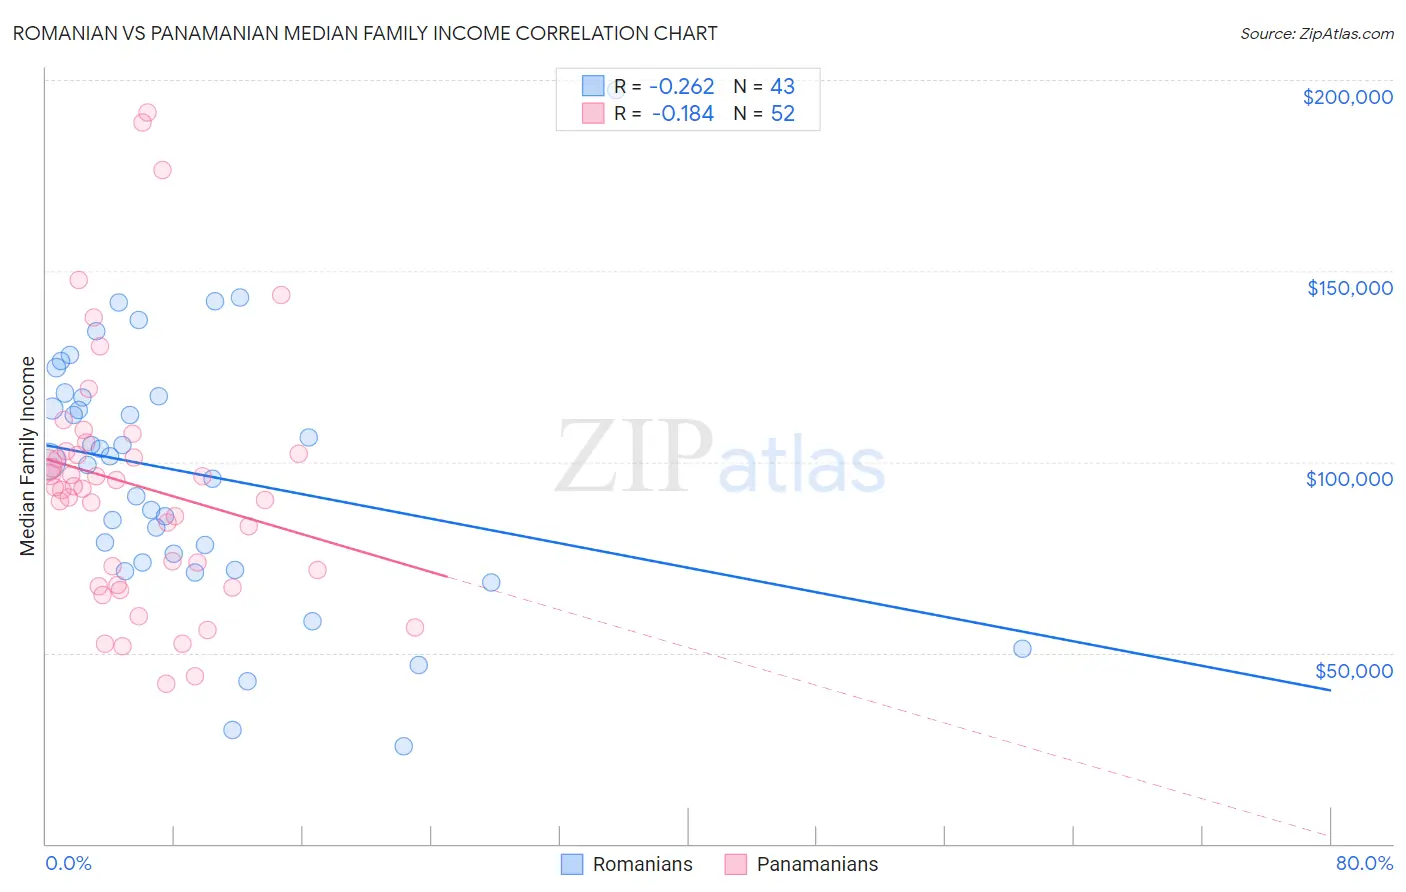
Romanian vs Panamanian Median Family Income Correlation Chart
The statistical analysis conducted on geographies consisting of 377,611,628 people shows a weak negative correlation between the proportion of Romanians and median family income in the United States with a correlation coefficient (R) of -0.262 and weighted average of $111,243. Similarly, the statistical analysis conducted on geographies consisting of 281,027,872 people shows a poor negative correlation between the proportion of Panamanians and median family income in the United States with a correlation coefficient (R) of -0.184 and weighted average of $97,683, a difference of 13.9%.
Median Family Income Correlation Summary
| Measurement | Romanian | Panamanian |
| Minimum | $25,417 | $41,845 |
| Maximum | $197,500 | $191,635 |
| Range | $172,083 | $149,790 |
| Mean | $96,934 | $93,845 |
| Median | $100,017 | $93,176 |
| Interquartile 25% (IQ1) | $73,551 | $69,694 |
| Interquartile 75% (IQ3) | $117,024 | $102,381 |
| Interquartile Range (IQR) | $43,473 | $32,687 |
| Standard Deviation (Sample) | $33,876 | $33,147 |
| Standard Deviation (Population) | $33,480 | $32,827 |
Similar Demographics by Median Family Income
Demographics Similar to Romanians by Median Family Income
In terms of median family income, the demographic groups most similar to Romanians are Austrian ($111,306, a difference of 0.060%), Croatian ($111,370, a difference of 0.11%), Ukrainian ($111,368, a difference of 0.11%), Immigrants from Hungary ($111,378, a difference of 0.12%), and Immigrants from Argentina ($110,873, a difference of 0.33%).
| Demographics | Rating | Rank | Median Family Income |
| Immigrants | North America | 99.2 /100 | #81 | Exceptional $112,151 |
| Immigrants | England | 99.2 /100 | #82 | Exceptional $112,038 |
| Immigrants | Egypt | 99.0 /100 | #83 | Exceptional $111,689 |
| Immigrants | Hungary | 98.8 /100 | #84 | Exceptional $111,378 |
| Croatians | 98.8 /100 | #85 | Exceptional $111,370 |
| Ukrainians | 98.8 /100 | #86 | Exceptional $111,368 |
| Austrians | 98.8 /100 | #87 | Exceptional $111,306 |
| Romanians | 98.8 /100 | #88 | Exceptional $111,243 |
| Immigrants | Argentina | 98.5 /100 | #89 | Exceptional $110,873 |
| Northern Europeans | 98.3 /100 | #90 | Exceptional $110,635 |
| Immigrants | Southern Europe | 98.3 /100 | #91 | Exceptional $110,614 |
| Immigrants | Lebanon | 97.9 /100 | #92 | Exceptional $110,159 |
| Immigrants | Kazakhstan | 97.8 /100 | #93 | Exceptional $110,137 |
| Koreans | 97.8 /100 | #94 | Exceptional $110,103 |
| Zimbabweans | 97.7 /100 | #95 | Exceptional $110,011 |
Demographics Similar to Panamanians by Median Family Income
In terms of median family income, the demographic groups most similar to Panamanians are Immigrants from Sudan ($97,737, a difference of 0.050%), Immigrants from Armenia ($97,605, a difference of 0.080%), Bermudan ($97,577, a difference of 0.11%), Nigerian ($97,522, a difference of 0.17%), and Immigrants from Bosnia and Herzegovina ($97,432, a difference of 0.26%).
| Demographics | Rating | Rank | Median Family Income |
| Hawaiians | 12.5 /100 | #205 | Poor $98,869 |
| Immigrants | Iraq | 12.1 /100 | #206 | Poor $98,786 |
| Aleuts | 11.6 /100 | #207 | Poor $98,702 |
| Immigrants | Uruguay | 9.2 /100 | #208 | Tragic $98,205 |
| Immigrants | Colombia | 8.7 /100 | #209 | Tragic $98,067 |
| Puget Sound Salish | 8.2 /100 | #210 | Tragic $97,958 |
| Immigrants | Sudan | 7.4 /100 | #211 | Tragic $97,737 |
| Panamanians | 7.2 /100 | #212 | Tragic $97,683 |
| Immigrants | Armenia | 7.0 /100 | #213 | Tragic $97,605 |
| Bermudans | 6.9 /100 | #214 | Tragic $97,577 |
| Nigerians | 6.7 /100 | #215 | Tragic $97,522 |
| Immigrants | Bosnia and Herzegovina | 6.4 /100 | #216 | Tragic $97,432 |
| Japanese | 6.0 /100 | #217 | Tragic $97,288 |
| Immigrants | Cambodia | 5.8 /100 | #218 | Tragic $97,222 |
| Delaware | 5.1 /100 | #219 | Tragic $96,958 |