Cuban vs Panamanian Unemployment Among Women with Children Ages 6 to 17 years
COMPARE
Cuban
Panamanian
Unemployment Among Women with Children Ages 6 to 17 years
Unemployment Among Women with Children Ages 6 to 17 years Comparison
Cubans
Panamanians
9.2%
UNEMPLOYMENT AMONG WOMEN WITH CHILDREN AGES 6 TO 17 YEARS
10.9/ 100
METRIC RATING
207th/ 347
METRIC RANK
9.3%
UNEMPLOYMENT AMONG WOMEN WITH CHILDREN AGES 6 TO 17 YEARS
4.5/ 100
METRIC RATING
227th/ 347
METRIC RANK
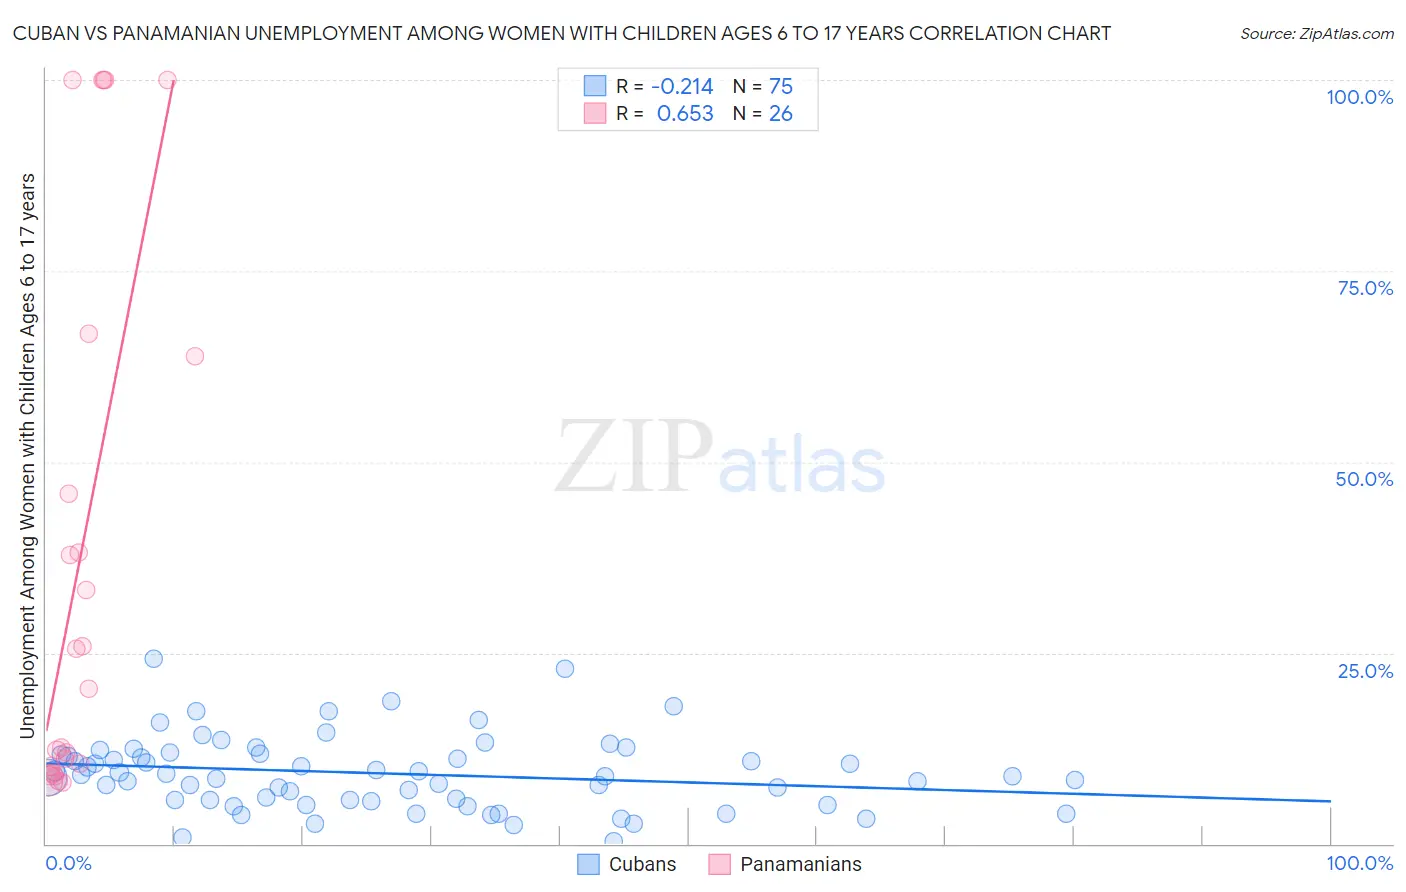
Cuban vs Panamanian Unemployment Among Women with Children Ages 6 to 17 years Correlation Chart
The statistical analysis conducted on geographies consisting of 317,366,594 people shows a weak negative correlation between the proportion of Cubans and unemployment rate among women with children between the ages 6 and 17 in the United States with a correlation coefficient (R) of -0.214 and weighted average of 9.2%. Similarly, the statistical analysis conducted on geographies consisting of 220,592,819 people shows a significant positive correlation between the proportion of Panamanians and unemployment rate among women with children between the ages 6 and 17 in the United States with a correlation coefficient (R) of 0.653 and weighted average of 9.3%, a difference of 1.0%.
Unemployment Among Women with Children Ages 6 to 17 years Correlation Summary
| Measurement | Cuban | Panamanian |
| Minimum | 0.30% | 8.0% |
| Maximum | 24.1% | 100.0% |
| Range | 23.8% | 92.0% |
| Mean | 9.2% | 37.6% |
| Median | 8.9% | 22.9% |
| Interquartile 25% (IQ1) | 5.7% | 10.1% |
| Interquartile 75% (IQ3) | 11.8% | 63.9% |
| Interquartile Range (IQR) | 6.1% | 53.8% |
| Standard Deviation (Sample) | 4.8% | 35.1% |
| Standard Deviation (Population) | 4.8% | 34.4% |
Demographics Similar to Cubans and Panamanians by Unemployment Among Women with Children Ages 6 to 17 years
In terms of unemployment among women with children ages 6 to 17 years, the demographic groups most similar to Cubans are Immigrants from Peru (9.2%, a difference of 0.010%), Salvadoran (9.2%, a difference of 0.010%), Finnish (9.2%, a difference of 0.10%), Immigrants from Cuba (9.2%, a difference of 0.15%), and Peruvian (9.2%, a difference of 0.23%). Similarly, the demographic groups most similar to Panamanians are Immigrants from the Azores (9.3%, a difference of 0.020%), Chinese (9.3%, a difference of 0.16%), Immigrants from El Salvador (9.3%, a difference of 0.18%), Immigrants from Eritrea (9.2%, a difference of 0.28%), and Crow (9.2%, a difference of 0.29%).
| Demographics | Rating | Rank | Unemployment Among Women with Children Ages 6 to 17 years |
| Cubans | 10.9 /100 | #207 | Poor 9.2% |
| Immigrants | Peru | 10.8 /100 | #208 | Poor 9.2% |
| Salvadorans | 10.7 /100 | #209 | Poor 9.2% |
| Finns | 10.0 /100 | #210 | Tragic 9.2% |
| Immigrants | Cuba | 9.6 /100 | #211 | Tragic 9.2% |
| Peruvians | 9.0 /100 | #212 | Tragic 9.2% |
| Spaniards | 8.2 /100 | #213 | Tragic 9.2% |
| Iroquois | 7.5 /100 | #214 | Tragic 9.2% |
| Immigrants | Germany | 7.2 /100 | #215 | Tragic 9.2% |
| Immigrants | Uruguay | 7.2 /100 | #216 | Tragic 9.2% |
| Germans | 7.2 /100 | #217 | Tragic 9.2% |
| Syrians | 6.9 /100 | #218 | Tragic 9.2% |
| Immigrants | Scotland | 6.6 /100 | #219 | Tragic 9.2% |
| Belgians | 6.4 /100 | #220 | Tragic 9.2% |
| Crow | 5.8 /100 | #221 | Tragic 9.2% |
| Immigrants | Southern Europe | 5.8 /100 | #222 | Tragic 9.2% |
| Immigrants | Eritrea | 5.8 /100 | #223 | Tragic 9.2% |
| Immigrants | El Salvador | 5.3 /100 | #224 | Tragic 9.3% |
| Chinese | 5.2 /100 | #225 | Tragic 9.3% |
| Immigrants | Azores | 4.6 /100 | #226 | Tragic 9.3% |
| Panamanians | 4.5 /100 | #227 | Tragic 9.3% |