Iroquois vs Panamanian Median Family Income
COMPARE
Iroquois
Panamanian
Median Family Income
Median Family Income Comparison
Iroquois
Panamanians
$90,543
MEDIAN FAMILY INCOME
0.2/ 100
METRIC RATING
271st/ 347
METRIC RANK
$97,683
MEDIAN FAMILY INCOME
7.2/ 100
METRIC RATING
212th/ 347
METRIC RANK
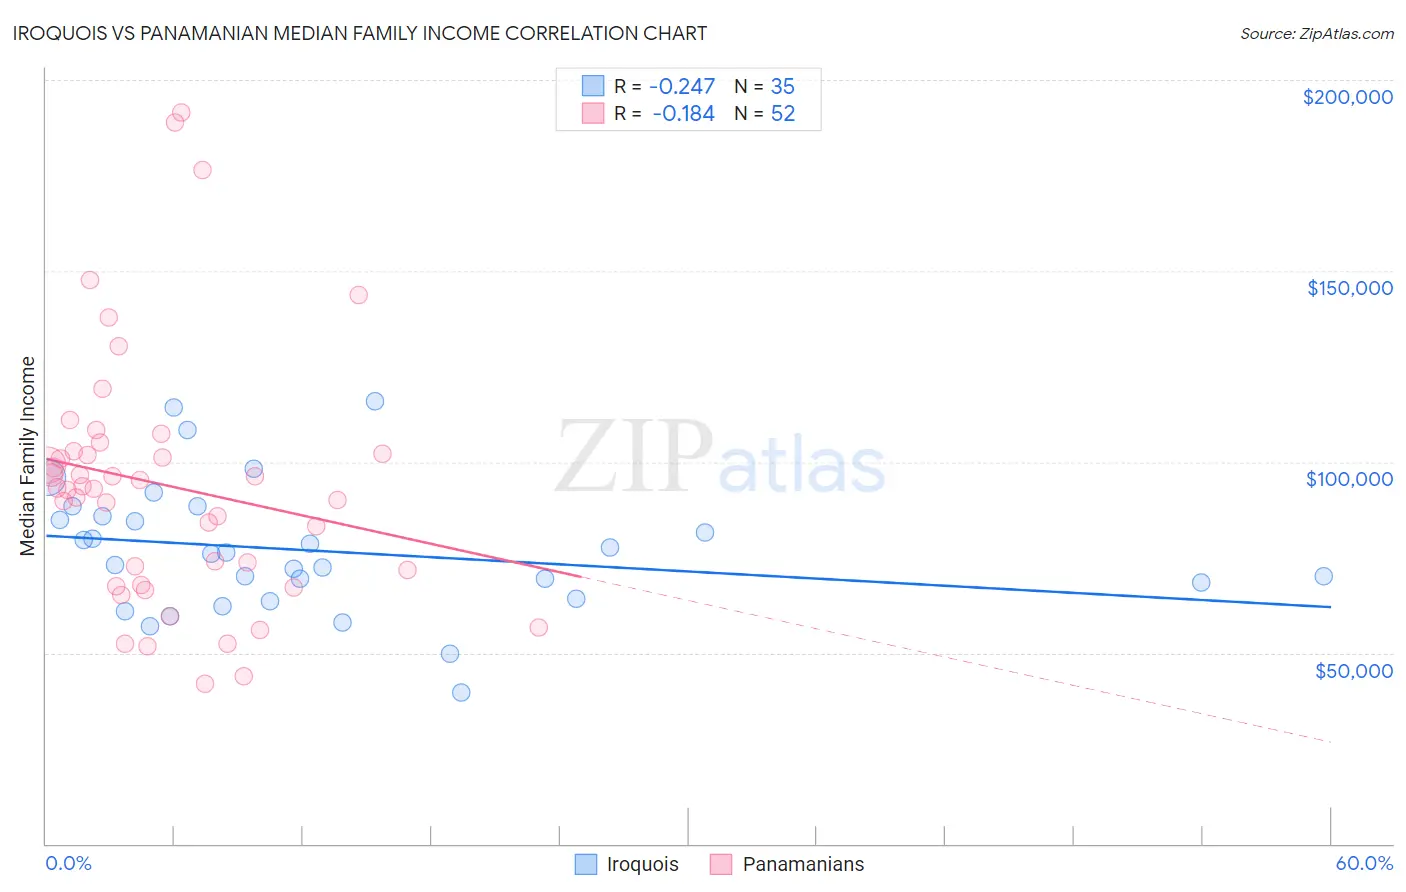
Iroquois vs Panamanian Median Family Income Correlation Chart
The statistical analysis conducted on geographies consisting of 207,203,022 people shows a weak negative correlation between the proportion of Iroquois and median family income in the United States with a correlation coefficient (R) of -0.247 and weighted average of $90,543. Similarly, the statistical analysis conducted on geographies consisting of 281,027,872 people shows a poor negative correlation between the proportion of Panamanians and median family income in the United States with a correlation coefficient (R) of -0.184 and weighted average of $97,683, a difference of 7.9%.
Median Family Income Correlation Summary
| Measurement | Iroquois | Panamanian |
| Minimum | $39,479 | $41,845 |
| Maximum | $115,891 | $191,635 |
| Range | $76,412 | $149,790 |
| Mean | $76,689 | $93,845 |
| Median | $75,795 | $93,176 |
| Interquartile 25% (IQ1) | $64,141 | $69,694 |
| Interquartile 75% (IQ3) | $85,646 | $102,381 |
| Interquartile Range (IQR) | $21,505 | $32,687 |
| Standard Deviation (Sample) | $16,973 | $33,147 |
| Standard Deviation (Population) | $16,729 | $32,827 |
Similar Demographics by Median Family Income
Demographics Similar to Iroquois by Median Family Income
In terms of median family income, the demographic groups most similar to Iroquois are Jamaican ($90,581, a difference of 0.040%), Immigrants from Liberia ($90,450, a difference of 0.10%), Immigrants from Micronesia ($90,345, a difference of 0.22%), Spanish American ($90,322, a difference of 0.24%), and Cree ($90,882, a difference of 0.37%).
| Demographics | Rating | Rank | Median Family Income |
| Senegalese | 0.3 /100 | #264 | Tragic $91,475 |
| Hmong | 0.3 /100 | #265 | Tragic $91,296 |
| Central Americans | 0.3 /100 | #266 | Tragic $91,087 |
| Mexican American Indians | 0.2 /100 | #267 | Tragic $90,918 |
| Cree | 0.2 /100 | #268 | Tragic $90,882 |
| Belizeans | 0.2 /100 | #269 | Tragic $90,880 |
| Jamaicans | 0.2 /100 | #270 | Tragic $90,581 |
| Iroquois | 0.2 /100 | #271 | Tragic $90,543 |
| Immigrants | Liberia | 0.2 /100 | #272 | Tragic $90,450 |
| Immigrants | Micronesia | 0.2 /100 | #273 | Tragic $90,345 |
| Spanish Americans | 0.2 /100 | #274 | Tragic $90,322 |
| Immigrants | St. Vincent and the Grenadines | 0.2 /100 | #275 | Tragic $90,094 |
| Immigrants | Zaire | 0.1 /100 | #276 | Tragic $89,285 |
| Immigrants | Jamaica | 0.1 /100 | #277 | Tragic $89,268 |
| Immigrants | Grenada | 0.1 /100 | #278 | Tragic $89,249 |
Demographics Similar to Panamanians by Median Family Income
In terms of median family income, the demographic groups most similar to Panamanians are Immigrants from Sudan ($97,737, a difference of 0.050%), Immigrants from Armenia ($97,605, a difference of 0.080%), Bermudan ($97,577, a difference of 0.11%), Nigerian ($97,522, a difference of 0.17%), and Immigrants from Bosnia and Herzegovina ($97,432, a difference of 0.26%).
| Demographics | Rating | Rank | Median Family Income |
| Hawaiians | 12.5 /100 | #205 | Poor $98,869 |
| Immigrants | Iraq | 12.1 /100 | #206 | Poor $98,786 |
| Aleuts | 11.6 /100 | #207 | Poor $98,702 |
| Immigrants | Uruguay | 9.2 /100 | #208 | Tragic $98,205 |
| Immigrants | Colombia | 8.7 /100 | #209 | Tragic $98,067 |
| Puget Sound Salish | 8.2 /100 | #210 | Tragic $97,958 |
| Immigrants | Sudan | 7.4 /100 | #211 | Tragic $97,737 |
| Panamanians | 7.2 /100 | #212 | Tragic $97,683 |
| Immigrants | Armenia | 7.0 /100 | #213 | Tragic $97,605 |
| Bermudans | 6.9 /100 | #214 | Tragic $97,577 |
| Nigerians | 6.7 /100 | #215 | Tragic $97,522 |
| Immigrants | Bosnia and Herzegovina | 6.4 /100 | #216 | Tragic $97,432 |
| Japanese | 6.0 /100 | #217 | Tragic $97,288 |
| Immigrants | Cambodia | 5.8 /100 | #218 | Tragic $97,222 |
| Delaware | 5.1 /100 | #219 | Tragic $96,958 |