Indian (Asian) vs Immigrants from Uzbekistan Median Family Income

COMPARE

Indian (Asian)
Race
Ancestry
AfghanAfricanAlaska NativeAlaskan AthabascanAlbanianAleutAlsatianAmericanApacheArabArapahoArgentineanArmenianAssyrian/Chaldean/SyriacAustralianAustrianBahamianBangladeshiBarbadianBasqueBelgianBelizeanBermudanBhutaneseBlackfeetBolivianBrazilianBritishBritish West IndianBulgarianBurmeseCajunCambodianCanadianCape VerdeanCarpatho RusynCelticCentral AmericanCentral American IndianCherokeeCheyenneChickasawChileanChineseChippewaChoctawColombianColvilleComancheCosta RicanCreeCreekCroatianCrowCubanCypriotCzechCzechoslovakianDanishDelawareDominicanDutchDutch West IndianEastern EuropeanEcuadorianEgyptianEnglishEstonianEthiopianEuropeanFijianFilipinoFinnishFrenchFrench American IndianFrench CanadianGermanGerman RussianGhanaianGreekGuamanian/ChamorroGuatemalanGuyaneseHaitianHmongHonduranHopiHoumaHungarianIcelanderIndian (Asian)IndonesianInupiatIranianIraqiIrishIroquoisIsraeliItalianJamaicanJapaneseJordanianKenyanKiowaKoreanLaotianLatvianLebaneseLiberianLithuanianLumbeeLuxembourgerMacedonianMalaysianMalteseMarshalleseMenomineeMexicanMexican American IndianMongolianMoroccanNative HawaiianNavajoNepaleseNew ZealanderNicaraguanNigerianNorthern EuropeanNorwegianOkinawanOsageOttawaPaiutePakistaniPalestinianPanamanianParaguayanPennsylvania GermanPeruvianPimaPolishPortuguesePotawatomiPuebloPuerto RicanPuget Sound SalishRomanianRussianSalvadoranSamoanScandinavianScotch-IrishScottishSeminoleSenegaleseSerbianShoshoneSierra LeoneanSiouxSlavicSlovakSloveneSomaliSouth AfricanSouth AmericanSouth American IndianSoviet UnionSpaniardSpanishSpanish AmericanSpanish American IndianSri LankanSubsaharan AfricanSudaneseSwedishSwissSyrianTaiwaneseThaiTlingit-HaidaTohono O'OdhamTonganTrinidadian and TobagonianTsimshianTurkishU.S. Virgin IslanderUgandanUkrainianUruguayanUteVenezuelanVietnameseWelshWest IndianYakamaYaquiYugoslavianYumanYup'ikZimbabwean
Immigration
NonimmigrantsImmigrantsAfghanistanAfricaAlbaniaArgentinaArmeniaAsiaAustraliaAustriaBahamasBangladeshBarbadosBelarusBelgiumBelizeBoliviaBosnia and HerzegovinaBrazilBulgariaBurma/MyanmarCabo VerdeCambodiaCameroonCanadaCaribbeanCentral AmericaChileChinaColombiaCongoCosta RicaCroatiaCubaCzechoslovakiaDenmarkDominicaDominican RepublicEastern AfricaEastern AsiaEastern EuropeEcuadorEgyptEl SalvadorEnglandEritreaEthiopiaEuropeFijiFranceGermanyGhanaGreeceGrenadaGuatemalaGuyanaHaitiHondurasHong KongHungaryIndiaIndonesiaIranIraqIrelandIsraelItalyJamaicaJapanJordanKazakhstanKenyaKoreaKuwaitLaosLatin AmericaLatviaLebanonLiberiaLithuaniaMalaysiaMexicoMicronesiaMiddle AfricaMoldovaMoroccoNepalNetherlandsNicaraguaNigeriaNorth AmericaNorth MacedoniaNorthern AfricaNorthern EuropeNorwayOceaniaPakistanPanamaPeruPhilippinesPolandPortugalRomaniaRussiaSaudi ArabiaScotlandSenegalSerbiaSierra LeoneSingaporeSomaliaSouth AfricaSouth AmericaSouth Central AsiaSouth Eastern AsiaSouthern EuropeSpainSri LankaSt. Vincent and the GrenadinesSudanSwedenSwitzerlandSyriaTaiwanThailandTrinidad and TobagoTurkeyUgandaUkraineUruguayVenezuelaVietnamWest IndiesWestern AfricaWestern AsiaWestern EuropeYemenZaireZimbabweAzores
Immigrants from Uzbekistan
Race
Ancestry
AfghanAfricanAlaska NativeAlaskan AthabascanAlbanianAleutAlsatianAmericanApacheArabArapahoArgentineanArmenianAssyrian/Chaldean/SyriacAustralianAustrianBahamianBangladeshiBarbadianBasqueBelgianBelizeanBermudanBhutaneseBlackfeetBolivianBrazilianBritishBritish West IndianBulgarianBurmeseCajunCambodianCanadianCape VerdeanCarpatho RusynCelticCentral AmericanCentral American IndianCherokeeCheyenneChickasawChileanChineseChippewaChoctawColombianColvilleComancheCosta RicanCreeCreekCroatianCrowCubanCypriotCzechCzechoslovakianDanishDelawareDominicanDutchDutch West IndianEastern EuropeanEcuadorianEgyptianEnglishEstonianEthiopianEuropeanFijianFilipinoFinnishFrenchFrench American IndianFrench CanadianGermanGerman RussianGhanaianGreekGuamanian/ChamorroGuatemalanGuyaneseHaitianHmongHonduranHopiHoumaHungarianIcelanderIndonesianInupiatIranianIraqiIrishIroquoisIsraeliItalianJamaicanJapaneseJordanianKenyanKiowaKoreanLaotianLatvianLebaneseLiberianLithuanianLumbeeLuxembourgerMacedonianMalaysianMalteseMarshalleseMenomineeMexicanMexican American IndianMongolianMoroccanNative HawaiianNavajoNepaleseNew ZealanderNicaraguanNigerianNorthern EuropeanNorwegianOkinawanOsageOttawaPaiutePakistaniPalestinianPanamanianParaguayanPennsylvania GermanPeruvianPimaPolishPortuguesePotawatomiPuebloPuerto RicanPuget Sound SalishRomanianRussianSalvadoranSamoanScandinavianScotch-IrishScottishSeminoleSenegaleseSerbianShoshoneSierra LeoneanSiouxSlavicSlovakSloveneSomaliSouth AfricanSouth AmericanSouth American IndianSoviet UnionSpaniardSpanishSpanish AmericanSpanish American IndianSri LankanSubsaharan AfricanSudaneseSwedishSwissSyrianTaiwaneseThaiTlingit-HaidaTohono O'OdhamTonganTrinidadian and TobagonianTsimshianTurkishU.S. Virgin IslanderUgandanUkrainianUruguayanUteVenezuelanVietnameseWelshWest IndianYakamaYaquiYugoslavianYumanYup'ikZimbabwean
Immigration
NonimmigrantsImmigrantsAfghanistanAfricaAlbaniaArgentinaArmeniaAsiaAustraliaAustriaBahamasBangladeshBarbadosBelarusBelgiumBelizeBoliviaBosnia and HerzegovinaBrazilBulgariaBurma/MyanmarCabo VerdeCambodiaCameroonCanadaCaribbeanCentral AmericaChileChinaColombiaCongoCosta RicaCroatiaCubaCzechoslovakiaDenmarkDominicaDominican RepublicEastern AfricaEastern AsiaEastern EuropeEcuadorEgyptEl SalvadorEnglandEritreaEthiopiaEuropeFijiFranceGermanyGhanaGreeceGrenadaGuatemalaGuyanaHaitiHondurasHong KongHungaryIndiaIndonesiaIranIraqIrelandIsraelItalyJamaicaJapanJordanKazakhstanKenyaKoreaKuwaitLaosLatin AmericaLatviaLebanonLiberiaLithuaniaMalaysiaMexicoMicronesiaMiddle AfricaMoldovaMoroccoNepalNetherlandsNicaraguaNigeriaNorth AmericaNorth MacedoniaNorthern AfricaNorthern EuropeNorwayOceaniaPakistanPanamaPeruPhilippinesPolandPortugalRomaniaRussiaSaudi ArabiaScotlandSenegalSerbiaSierra LeoneSingaporeSomaliaSouth AfricaSouth AmericaSouth Central AsiaSouth Eastern AsiaSouthern EuropeSpainSri LankaSt. Vincent and the GrenadinesSudanSwedenSwitzerlandSyriaTaiwanThailandTrinidad and TobagoTurkeyUgandaUkraineUruguayUzbekistanVenezuelaVietnamWest IndiesWestern AfricaWestern AsiaWestern EuropeYemenZaireZimbabweAzores
Median Family Income
Income
Poverty
Unemployment
Labor Participation
Family Structure
Vehicle Availability
Education Level
Disability

Median Family Income Comparison

Indians (Asian)

Immigrants from Uzbekistan

Exceptional
Average
$125,312
MEDIAN FAMILY INCOME
100.0/ 100
METRIC RATING
17th/ 347
METRIC RANK
$103,197
MEDIAN FAMILY INCOME
56.6/ 100
METRIC RATING
170th/ 347
METRIC RANK

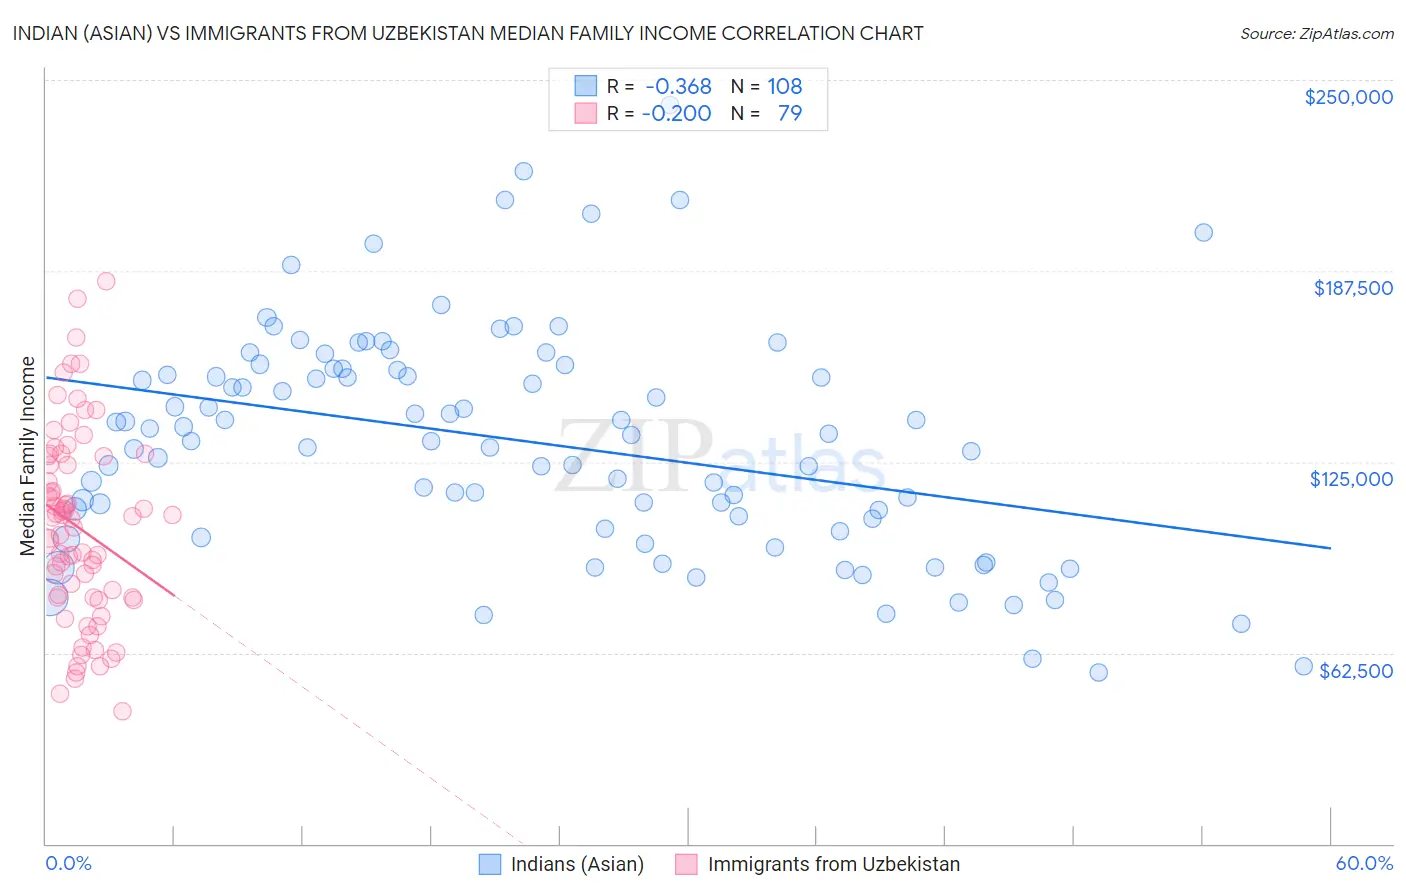
Indian (Asian) vs Immigrants from Uzbekistan Median Family Income Correlation Chart

The statistical analysis conducted on geographies consisting of 494,431,104 people shows a mild negative correlation between the proportion of Indians (Asian) and median family income in the United States with a correlation coefficient (R) of -0.368 and weighted average of $125,312. Similarly, the statistical analysis conducted on geographies consisting of 118,698,354 people shows a poor negative correlation between the proportion of Immigrants from Uzbekistan and median family income in the United States with a correlation coefficient (R) of -0.200 and weighted average of $103,197, a difference of 21.4%.
Indian (Asian) vs Immigrants from Uzbekistan Median Family Income

Median Family Income Correlation Summary

MeasurementIndian (Asian)Immigrants from Uzbekistan
Minimum$56,023$43,333
Maximum$241,763$184,083
Range$185,740$140,750
Mean$131,617$103,479
Median$132,818$106,438
Interquartile 25% (IQ1)$104,858$80,707
Interquartile 75% (IQ3)$155,124$126,877
Interquartile Range (IQR)$50,266$46,170
Standard Deviation (Sample)$36,827$30,925
Standard Deviation (Population)$36,656$30,729

Similar Demographics by Median Family Income

Demographics Similar to Indians (Asian) by Median Family Income

In terms of median family income, the demographic groups most similar to Indians (Asian) are Immigrants from Eastern Asia ($125,150, a difference of 0.13%), Immigrants from China ($125,540, a difference of 0.18%), Eastern European ($125,546, a difference of 0.19%), Immigrants from South Central Asia ($125,956, a difference of 0.51%), and Immigrants from Australia ($126,620, a difference of 1.0%).
DemographicsRating | RankMedian Family Income
Immigrants | Ireland
100.0
/100
|
#10
Exceptional
$127,584
Immigrants | Israel
100.0
/100
|
#11
Exceptional
$127,430
Cypriots
100.0
/100
|
#12
Exceptional
$127,064
Immigrants | Australia
100.0
/100
|
#13
Exceptional
$126,620
Immigrants | South Central Asia
100.0
/100
|
#14
Exceptional
$125,956
Eastern Europeans
100.0
/100
|
#15
Exceptional
$125,546
Immigrants | China
100.0
/100
|
#16
Exceptional
$125,540
Indians (Asian)
100.0
/100
|
#17
Exceptional
$125,312
Immigrants | Eastern Asia
100.0
/100
|
#18
Exceptional
$125,150
Immigrants | Belgium
100.0
/100
|
#19
Exceptional
$123,831
Burmese
100.0
/100
|
#20
Exceptional
$123,369
Immigrants | Korea
100.0
/100
|
#21
Exceptional
$122,800
Immigrants | Sweden
100.0
/100
|
#22
Exceptional
$122,765
Immigrants | Japan
100.0
/100
|
#23
Exceptional
$122,764
Immigrants | Northern Europe
100.0
/100
|
#24
Exceptional
$121,840

Demographics Similar to Immigrants from Uzbekistan by Median Family Income

In terms of median family income, the demographic groups most similar to Immigrants from Uzbekistan are Czechoslovakian ($103,273, a difference of 0.070%), Alsatian ($103,010, a difference of 0.18%), Immigrants from Peru ($103,534, a difference of 0.33%), Immigrants from Eritrea ($102,823, a difference of 0.36%), and Belgian ($102,788, a difference of 0.40%).
DemographicsRating | RankMedian Family Income
Costa Ricans
66.2
/100
|
#163
Good
$103,989
Sierra Leoneans
64.7
/100
|
#164
Good
$103,859
Slovaks
63.1
/100
|
#165
Good
$103,729
English
62.6
/100
|
#166
Good
$103,684
South American Indians
61.9
/100
|
#167
Good
$103,624
Immigrants | Peru
60.8
/100
|
#168
Good
$103,534
Czechoslovakians
57.6
/100
|
#169
Average
$103,273
Immigrants | Uzbekistan
56.6
/100
|
#170
Average
$103,197
Alsatians
54.3
/100
|
#171
Average
$103,010
Immigrants | Eritrea
51.9
/100
|
#172
Average
$102,823
Belgians
51.4
/100
|
#173
Average
$102,788
Finns
50.0
/100
|
#174
Average
$102,676
Immigrants | Eastern Africa
47.1
/100
|
#175
Average
$102,451
French
46.1
/100
|
#176
Average
$102,368
Germans
44.6
/100
|
#177
Average
$102,254