Dutch vs Immigrants from Uzbekistan Median Family Income
COMPARE
Dutch
Immigrants from Uzbekistan
Median Family Income
Median Family Income Comparison
Dutch
Immigrants from Uzbekistan
$101,192
MEDIAN FAMILY INCOME
31.9/ 100
METRIC RATING
185th/ 347
METRIC RANK
$103,197
MEDIAN FAMILY INCOME
56.6/ 100
METRIC RATING
170th/ 347
METRIC RANK
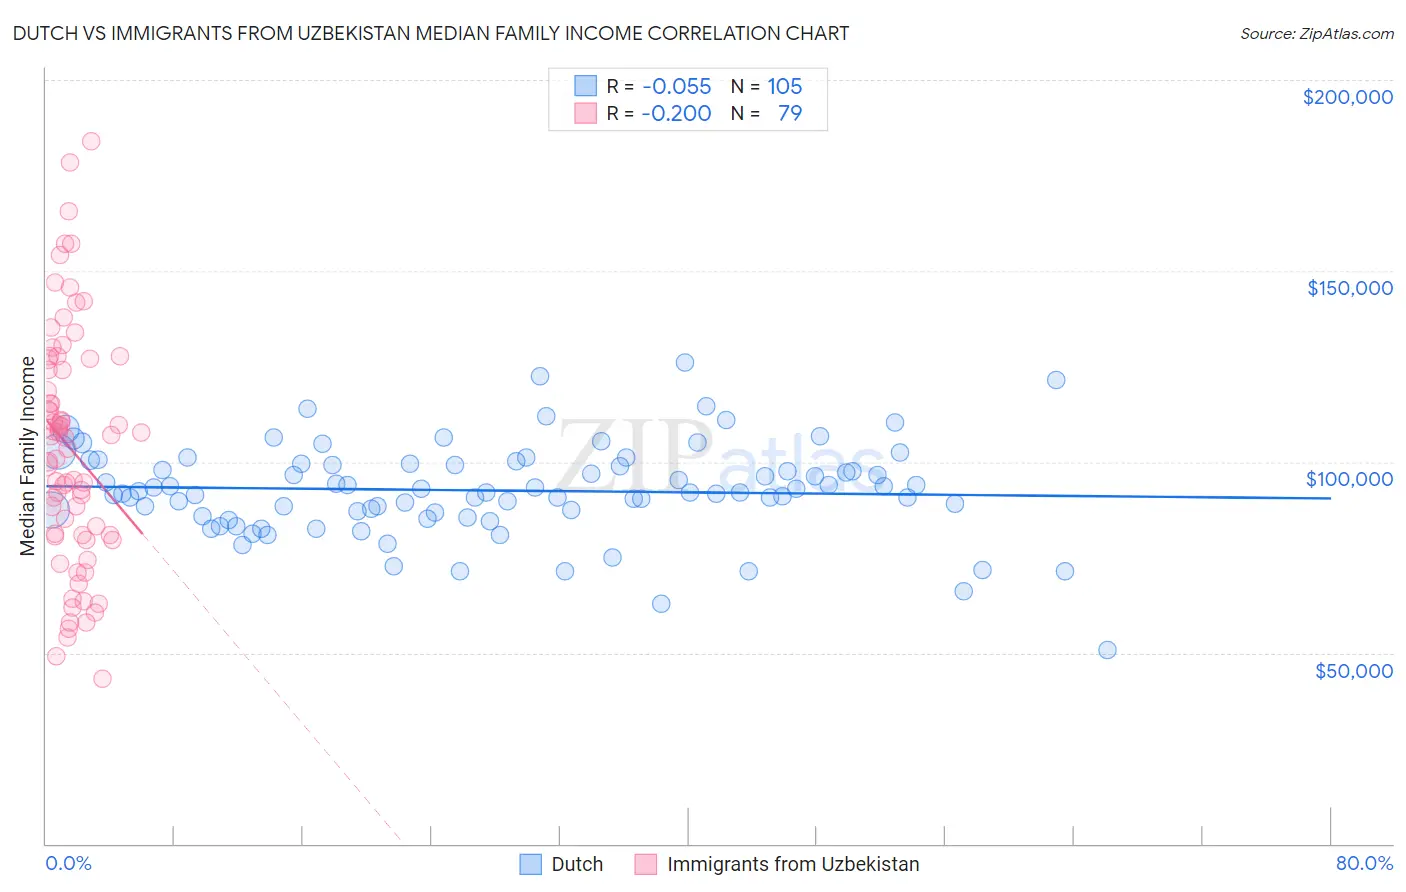
Dutch vs Immigrants from Uzbekistan Median Family Income Correlation Chart
The statistical analysis conducted on geographies consisting of 553,300,632 people shows a slight negative correlation between the proportion of Dutch and median family income in the United States with a correlation coefficient (R) of -0.055 and weighted average of $101,192. Similarly, the statistical analysis conducted on geographies consisting of 118,698,354 people shows a poor negative correlation between the proportion of Immigrants from Uzbekistan and median family income in the United States with a correlation coefficient (R) of -0.200 and weighted average of $103,197, a difference of 2.0%.
Median Family Income Correlation Summary
| Measurement | Dutch | Immigrants from Uzbekistan |
| Minimum | $50,679 | $43,333 |
| Maximum | $126,042 | $184,083 |
| Range | $75,363 | $140,750 |
| Mean | $92,505 | $103,479 |
| Median | $92,000 | $106,438 |
| Interquartile 25% (IQ1) | $86,239 | $80,707 |
| Interquartile 75% (IQ3) | $99,471 | $126,877 |
| Interquartile Range (IQR) | $13,232 | $46,170 |
| Standard Deviation (Sample) | $12,293 | $30,925 |
| Standard Deviation (Population) | $12,235 | $30,729 |
Demographics Similar to Dutch and Immigrants from Uzbekistan by Median Family Income
In terms of median family income, the demographic groups most similar to Dutch are Celtic ($101,139, a difference of 0.050%), Tlingit-Haida ($101,092, a difference of 0.10%), Immigrants from Costa Rica ($101,354, a difference of 0.16%), Kenyan ($101,417, a difference of 0.22%), and Tsimshian ($101,543, a difference of 0.35%). Similarly, the demographic groups most similar to Immigrants from Uzbekistan are Czechoslovakian ($103,273, a difference of 0.070%), Alsatian ($103,010, a difference of 0.18%), Immigrants from Peru ($103,534, a difference of 0.33%), Immigrants from Eritrea ($102,823, a difference of 0.36%), and Belgian ($102,788, a difference of 0.40%).
| Demographics | Rating | Rank | Median Family Income |
| South American Indians | 61.9 /100 | #167 | Good $103,624 |
| Immigrants | Peru | 60.8 /100 | #168 | Good $103,534 |
| Czechoslovakians | 57.6 /100 | #169 | Average $103,273 |
| Immigrants | Uzbekistan | 56.6 /100 | #170 | Average $103,197 |
| Alsatians | 54.3 /100 | #171 | Average $103,010 |
| Immigrants | Eritrea | 51.9 /100 | #172 | Average $102,823 |
| Belgians | 51.4 /100 | #173 | Average $102,788 |
| Finns | 50.0 /100 | #174 | Average $102,676 |
| Immigrants | Eastern Africa | 47.1 /100 | #175 | Average $102,451 |
| French | 46.1 /100 | #176 | Average $102,368 |
| Germans | 44.6 /100 | #177 | Average $102,254 |
| Welsh | 43.3 /100 | #178 | Average $102,151 |
| South Americans | 39.7 /100 | #179 | Fair $101,856 |
| French Canadians | 37.0 /100 | #180 | Fair $101,634 |
| Spaniards | 36.8 /100 | #181 | Fair $101,617 |
| Tsimshian | 35.9 /100 | #182 | Fair $101,543 |
| Kenyans | 34.5 /100 | #183 | Fair $101,417 |
| Immigrants | Costa Rica | 33.7 /100 | #184 | Fair $101,354 |
| Dutch | 31.9 /100 | #185 | Fair $101,192 |
| Celtics | 31.3 /100 | #186 | Fair $101,139 |
| Tlingit-Haida | 30.8 /100 | #187 | Fair $101,092 |